
You have invested time and budget into building a beautiful landing page, creating sales copy, designing visuals and building a marketing campaign to promote it. Now it’s time to see how it’s performing.
In this article I will share the top 6 landing page performance metrics and how to set them up in Google Analytics 4 (GA4). GA4 offers considerable improvements in their approach to landing page metrics compared to what was available (and criticized) in the previous Analytics version.
In the second part of this article I will share tips on how to run the analysis of your metrics in GA4. I highly recommend reviewing this section to learn how to find powerful insights for your analysis.
Table of Contents:
- What are Landing Page Performance Metrics
- Landing Page report in GA4
- Top 6 Landing Page Performance Metrics
- Tips to Analyze Your Landing Page Performance Metrics
- Takeaways
Let’s dive in!
What are Landing Page Performance Metrics
Landing page performance metrics are numerical values used to track and evaluate the success of a landing page and a marketing effort that relies on that page. Landing page performance metrics can help you identify areas of good performance and other areas that can be improved.
Some good metrics ideas to report on a landing page performance are:
- Volumes of traffic – a way to indicate how many times the landing page was accessed. Specific metrics that can help you quantify this aspect are: the number of users or sessions
- Completions of the campaign goal – a way to indicate how many times the key action was completed. Specific metrics are the number of form submissions, purchases, downloads, etc. These are measured in GA4 under the concept of Conversions.
- Conversion rate – a way to indicate how efficient the page is in having the users complete the conversion such as a purchase, a form submission, or other.
- Engagement – a way to indicate users’ interest and the relevance of the landing page content to the intent of the users who visited it. Average Engagement Time or Engagement Rate are example of new GA4 metrics that can help gauge the levels of engagement.
Choosing the right metrics
The specific metrics that you want to include in your tracking depend on your goals for the campaign. In general, a landing page will have a desired action you want the users to take such as a signup, contact form, download, purchase, etc. This desired action will impact what metrics you will use to report on the performance of your landing page.
Apart from this action you might also have other business or marketing goals such as increased exposure of your brand or product to your target audience or extracting the maximum value from a limited advertising budget. For example you might be looking for a cheaper way to generate leads.
It is important to remember that the performance of a landing page is often linked to other external factors. When evaluating the performance metrics, bear in mind that good or poor results might be due or partially due to those aspects. Important considerations include:
Users
Who they are and with what intent they land on your page. A person who lives in another state might not engage you for services that you provide in your state. A person who doesn’t have a problem that your product solves will probably not buy it.
The gear
The device that is used to access your page. Your page looks very different on desktops, tablets and mobiles. People might pay attention to different things when they visit on mobiles vs. desktops. Also, people use desktops and mobiles for different task and it may impact the success of your landing page. For example, if your landing page’s goal is to have people download a PDF case study, consider that some people might want to download a PDF on a desktop device only where it will be easier for them to study it.
Landing Page report in GA4
GA4 offers a default landing page report, that can be found under Reports > Engagement.
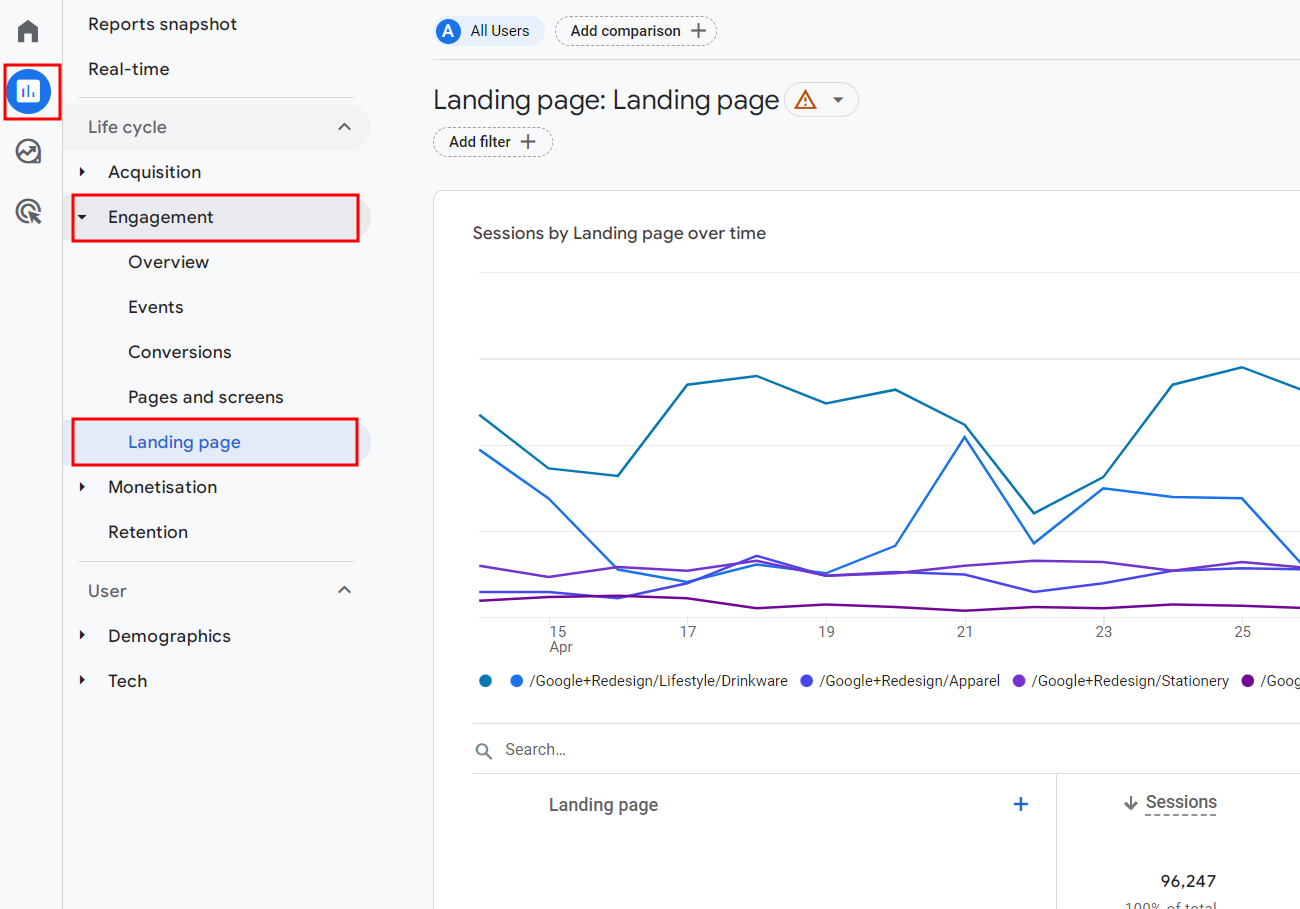
GA4’s landing page report is build to help you analyze any page of your website when it is the start of someone’s visit to your website. The pages in that report may not be related to any specific marketing effort and might not even have a desired interaction such as a contact form or a signup form. It is simply a list of all pages that are frequently the starting point for users visiting your website, be it the homepage, a blog page, login page, a category page etc.
In this article, I will show you how to customize this report to turn it into one useful in an analysis of a landing page build to serve a marketing campaign. I will show you which metrics to add and how to make the necessary edits to create a report that will give you answers.
Let’s discuss the performance metrics.
Top 6 Landing Page Performance Metrics
Engaged Sessions
Not everyone who starts a session on your page is going to read the page. People open multiple tabs, get distracted and switch to another task, or get impatient waiting for the content to load and shut it down after a couple of seconds.
Engaged sessions is an improvement on the traditional metric of sessions. This is GA4’s attempt at providing better metrics that represent meaningful interactions with your landing pages.
The engaged sessions metric indicates the number of sessions that lasted longer than 10 seconds, or had a conversion event, or had 2 or more screen or page views.
This metric has the potential to be an eye-opener. If you compare it side-by-side with the sessions, it can even help you identify a bug on your website. If you are paying per click to drive traffic to your landing page, check the differences between the clicks you are paying for and the engaged sessions you are getting. Use it to improve your campaign targeting or to review the need to speed up the loading times.
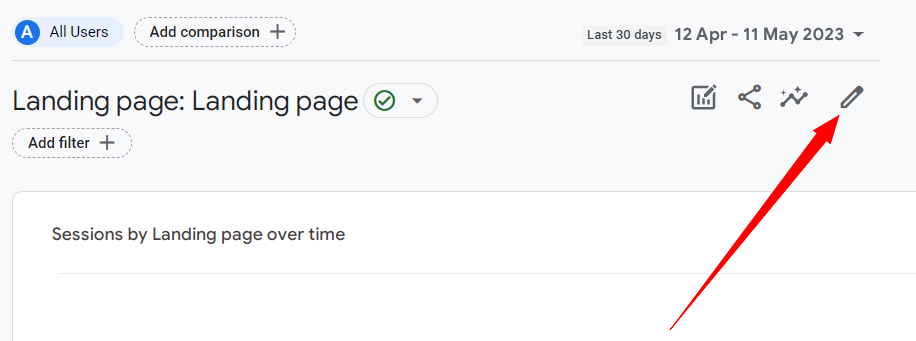
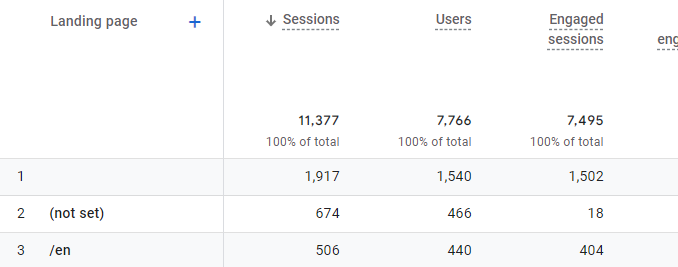
To find the Engaged Sessions, edit the landing pages report.
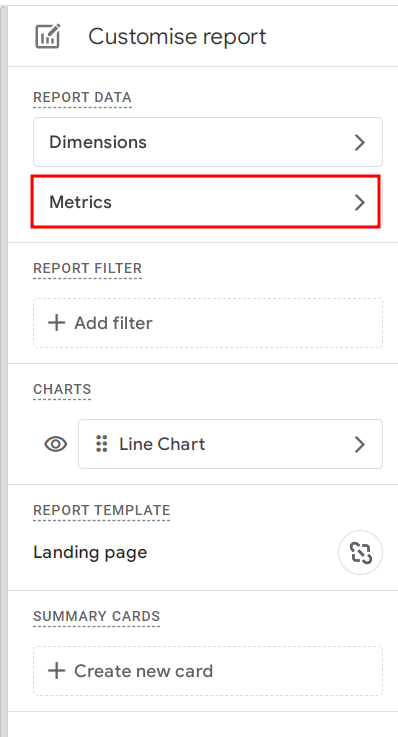
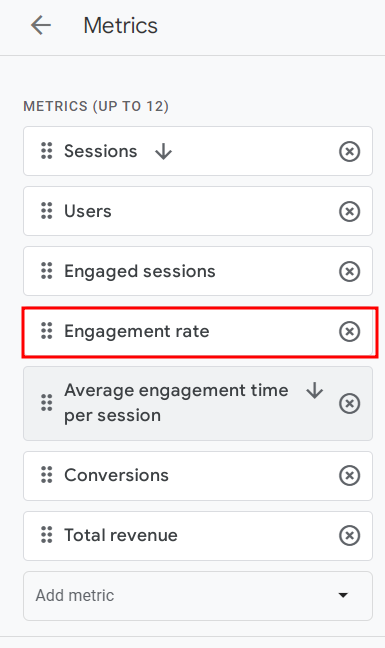
Next, click on Metrics and in the Add metric field type Engaged Sessions.
I like to move my Engaged Session next to Sessions and Users in my report so that I can compare the numbers side by side. I also remove New Users.
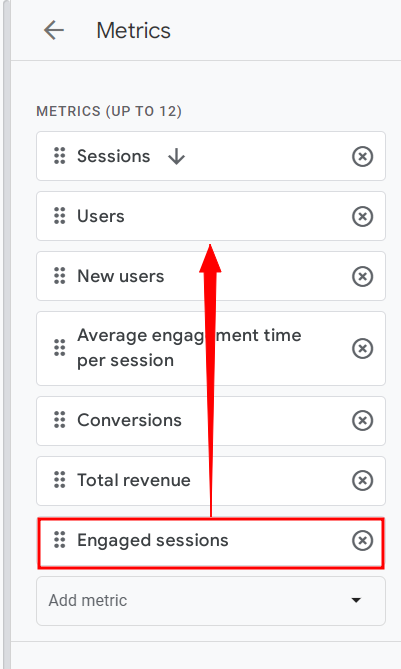
Rearrange the order and remove New Users then hit Apply.
Well done, you have added the first metrics to the GA4 report. In the next steps you will configure the other top metrics to it, so don’t save it yet, keep reading.
Engagement Rate
This metric shows you what percentage of all sessions are sessions with a meaningful interaction. It is calculated by dividing the engaged sessions by sessions.
If you are evaluating the results of a targeted campaign (such as PPC, or a segmented email campaign) and your landing page’s engagement rate is lower than 75% than you should look for improvement opportunities. Some areas to look at are the improved targeting of high-intent audiences, a better match between the pre-click message and the landing page messaging, simplifying layout and improving the clarity.
If you are evaluating landing pages that are less sale oriented or that are not attached to a single campaign but get traffic from multiple channels your benchmark engagement rate will be lower. In those cases the rate of between 50-65% would be considered a normal rate. It’s because you have limited control over who the visitors are and their intent, your page might be driving lots of search engine traffic corresponding to a variety of keywords and intents.
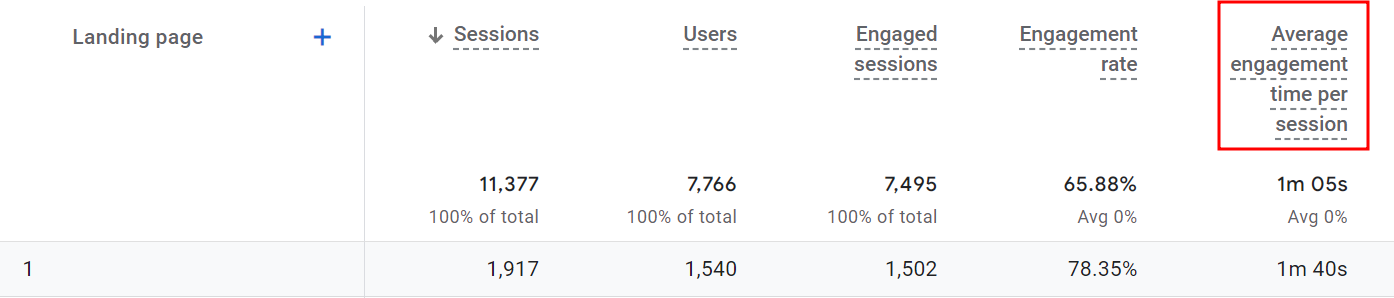
To find your engagement rate edit the report metrics and search for it then add it. I place it next to the Engaged Sessions.
Average Engagement Time Per Session
This metric indicates the time that users spend engaging with your page.
It allows you to spot issues at a glance. If your average is just a few seconds then you should look for ways to improve your landing page and/or campaign that generates the visits.
To find this metric in GA4 just look at the columns of the report because it is a default metric in the landing pages report.
Conversions
Conversions is a top metric to track on a landing page that has an action you desire the users to take. It is often the main objective of your campaign. Typical examples include a form submission, a signup, and purchase.
Conversions tracking is crucial as it allows you to evaluate the success of your campaign, “we have 50 new leads this month”. It also allows you to calculate the Cost per Acquisition (CPA) or Cost per Lead, and the Conversion Rate, which is the percentage of users who performed the desired action.
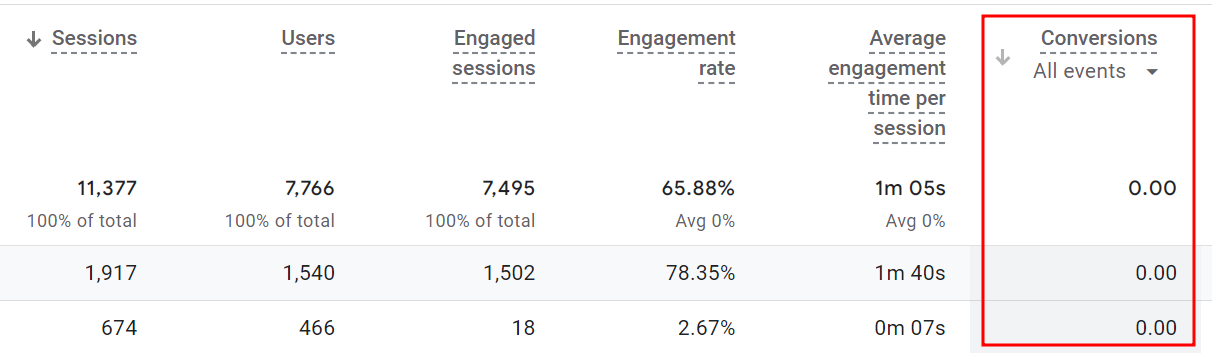
Make sure to track this action as a conversion event in your GA4 because in the de fault setup only the purchase event is tracked as a conversion. To check if your objective is a conversion in your GA4 go to Admin > Conversions and search the list.
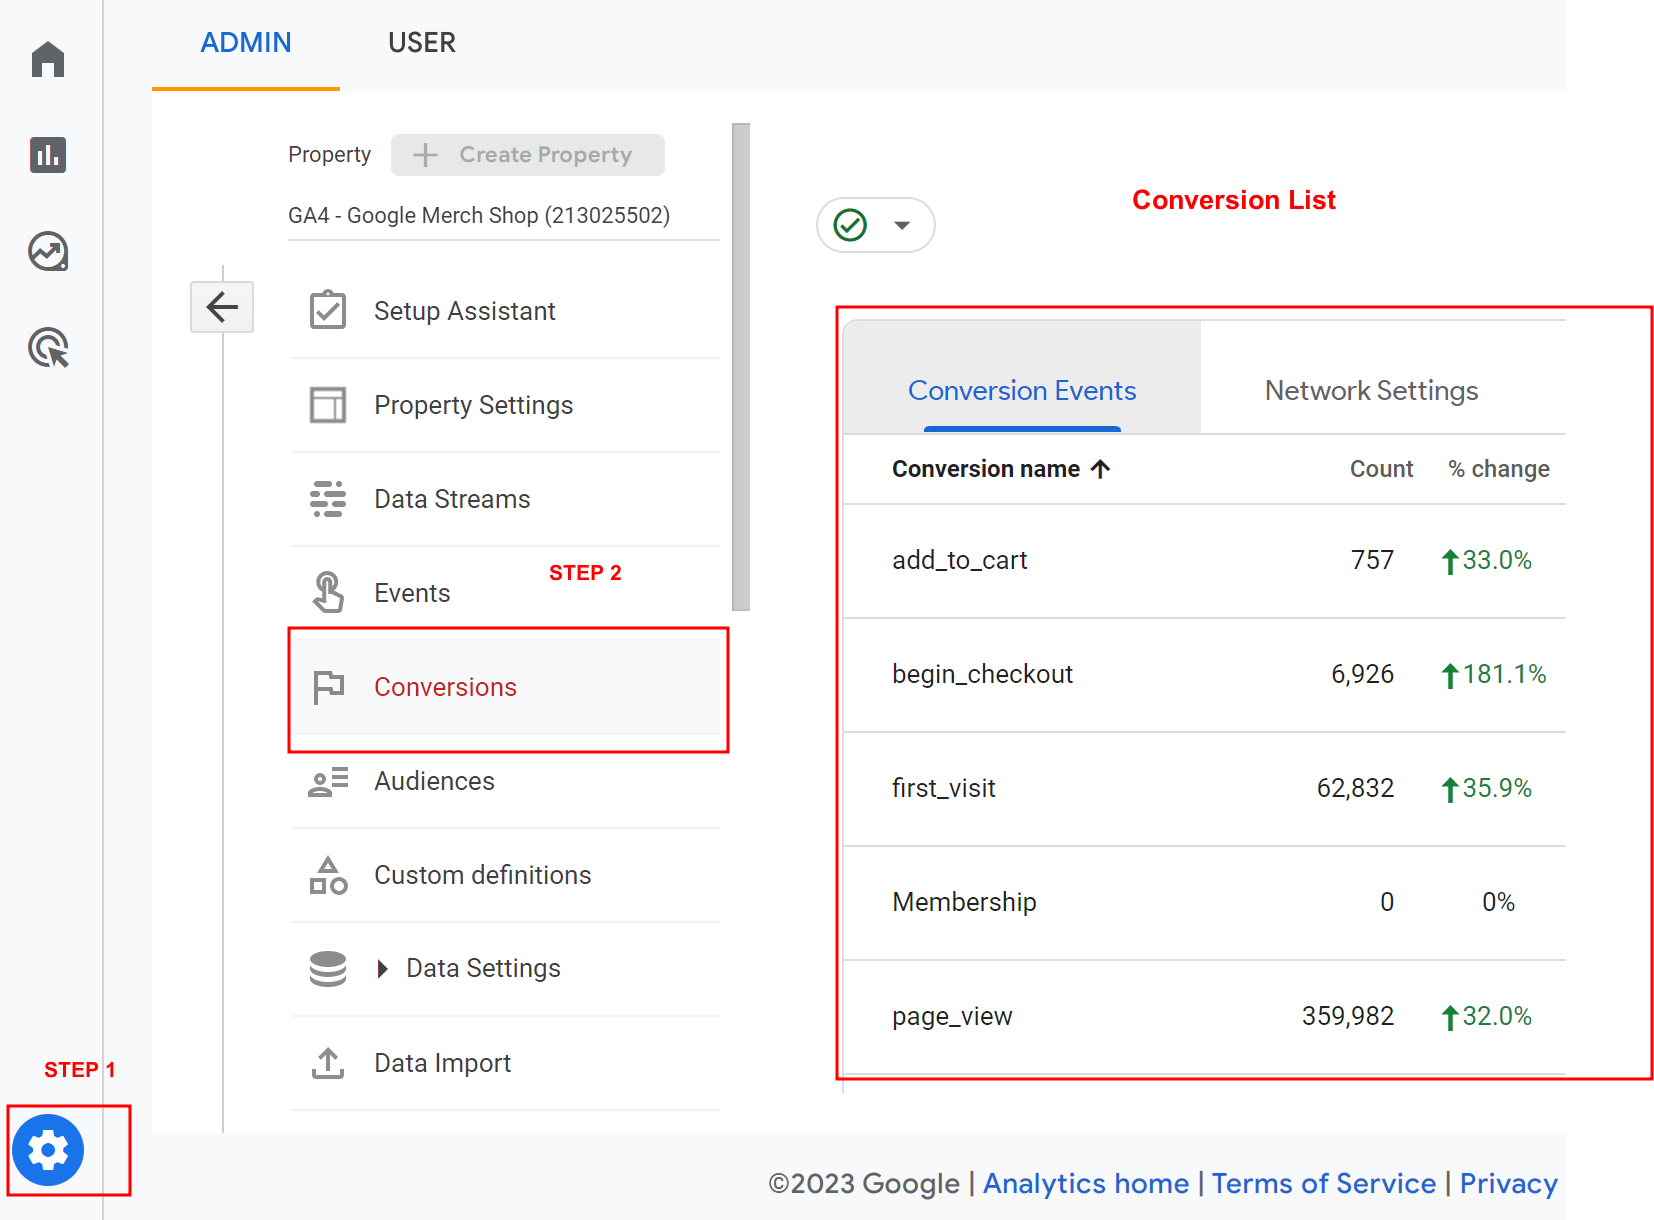
Your GA4 default setup only includes purchase as conversion, so if you never worked on your conversion setup you need to do it now. By default your landing page report shows 0 conversions until you set up the tracking of your desired actions.
One easy ways to have it set up is to connect your action to a post-action page such as a “thank you page” that shows after a users completed the action.
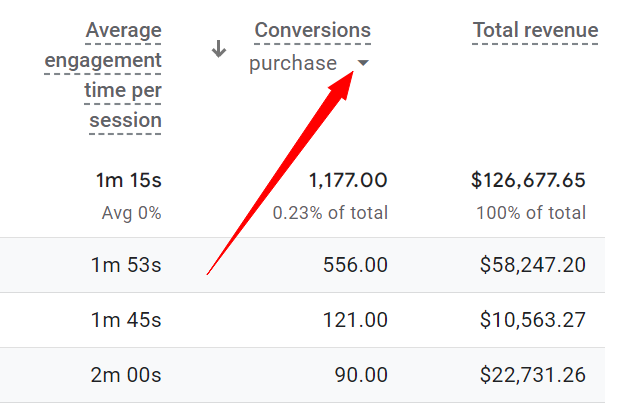
If you already have conversions set up, make sure to only add to this report the numbers for the specific conversion on your landing page. Use the conversion filter to include the right conversion event. In this example I added purchase as my filter.
Conversion Rate
It is the percentage of users who completed the desired action on your landing page. It is calculated by dividing the number of conversions by the number of users.
Similar to Conversions this metric indicates the success related to the completion of the most desired action on your landing page.
This metric comes especially helpful if you want to evaluate the success of your campaign or landing page as compared to a historical or industry benchmark or to other running initiatives.
If you are comparing results of 2 landing pages you don’t want to just look at the number of conversions, you must also consider the number of users that visited this page. As the volume of users may be very different in those cases, the conversion rate is a better way to see which landing page was better at converting the users it received. You may find that a page with a lower number of conversions has a higher conversion rate than a landing page that was used in a previous campaign.
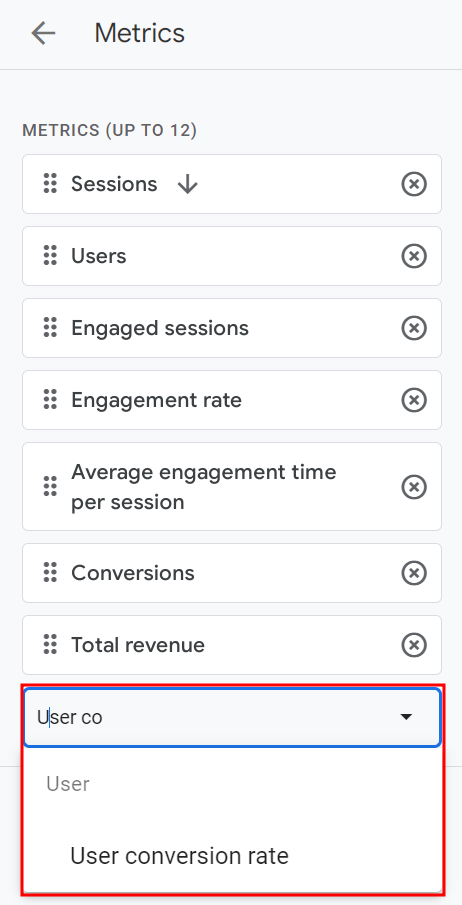
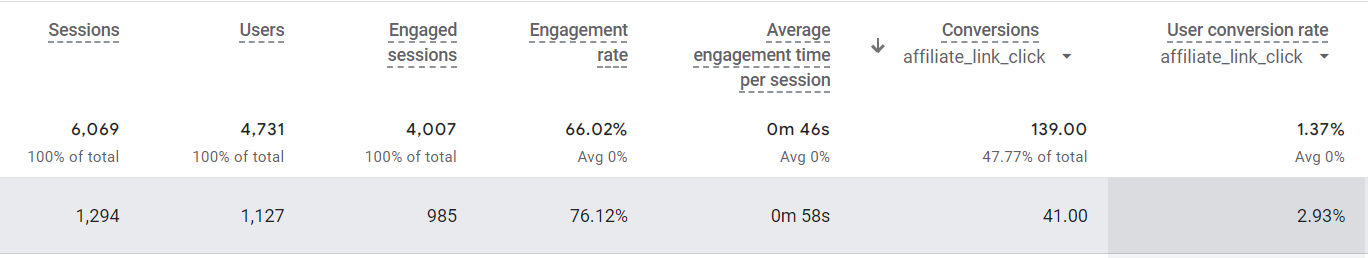
To find this metric in GA4 edit the landing page report and under Metrics search for User Conversion Rate.
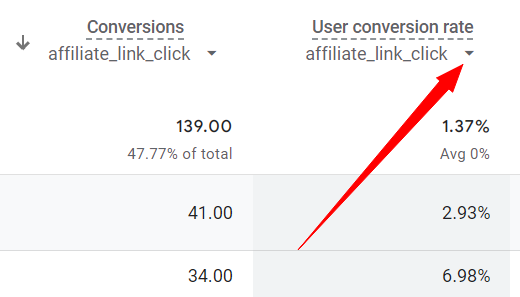
Set the filter to the conversion action you are tracking for this landing page.
In this example the filter is set to include only conversions called affiliate_link_click.
Interaction with the Steps of the Conversion Funnel
Some landing pages have conversion actions requiring 2 or multiple steps e.g. first you need to click the CTA button to be then taken to a contact form or a checkout.
Similar to Conversion Rate for your final conversion action, such as a form submission or a purchase, you may want to measure also the previous steps, such as the CTA button click and/or partial submissions if your form or the checkout process has multiple steps.
To get the full picture of what’s happening on your landing page measure the interactions with the previous steps. Finding out that users do click the CTA button but don’t submit the form will result in different conclusions than seeing they never clicked the CTA button in the first place. In the first case, it looks like your traffic has the right intent but may be experiencing as issue with the form. However, if users ignore the CTA button and exit the page you will want to evaluate the clarity of your message, visibility of your CTA button or your traffic generation strategy.
To find this metric change the filter on the user conversion rate, that you already added to your report in previous step. You cannot add an additional conversion or conversion rate metric to the report, but you can jump between them with the use of the filter arrow.
Congratulations, you have now built your custom GA4 landing page report that includes the top performance metrics.
Tips to Analyze your Landing Page Performance Metrics
Before you start analyzing your metrics, learn those tips to make your analysis more powerful.
Report Filter
Use the report filter to display only the landing page you are currently analyzing.
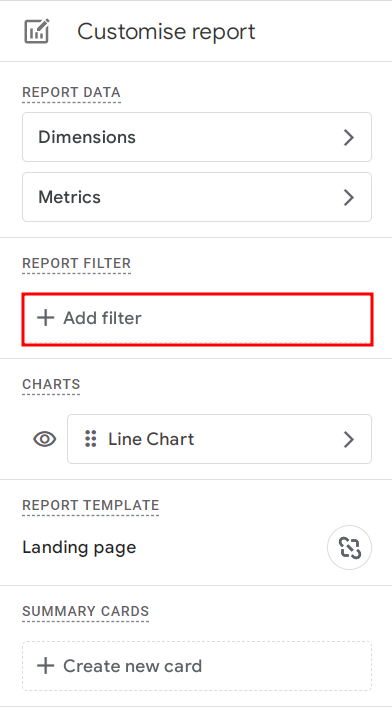
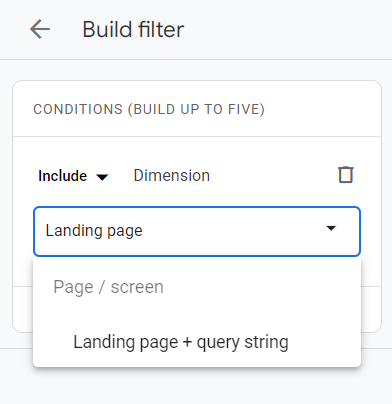
Choose Include > Landing page + query string and check your landing page on the list of all pages. Hit Apply.
Report Dimensions
Use dimensions to slice your data in a meaningful way and uncover powerful insights.
Audience
Check who is coming to your landing page.
You might want to exclude certain audiences from your analysis e.g. you are only providing services or selling to certain geographical areas. If you don’t sell outside US, why analyze the performance of the visitors from other countries? If you provide services in a physical location in your town, you can exclude from your analysis other geographical areas.
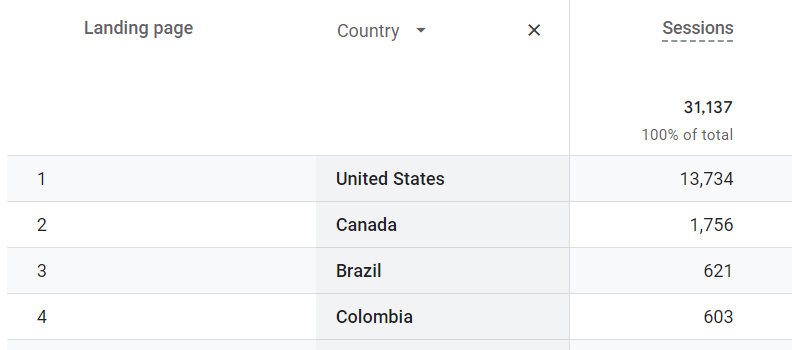
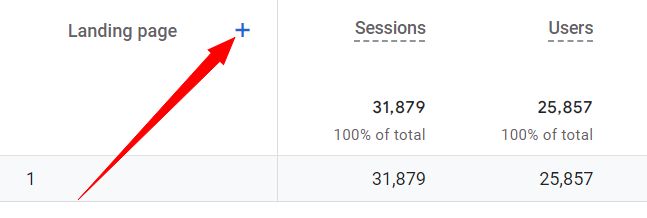
Apply a secondary dimension to your report and see if you need to exclude any geo areas. First use the secondary dimension of Country. Click the + sign .
If you are seeing high volume of traffic that is entirely off-target for your landing page objective you may want to exclude it.
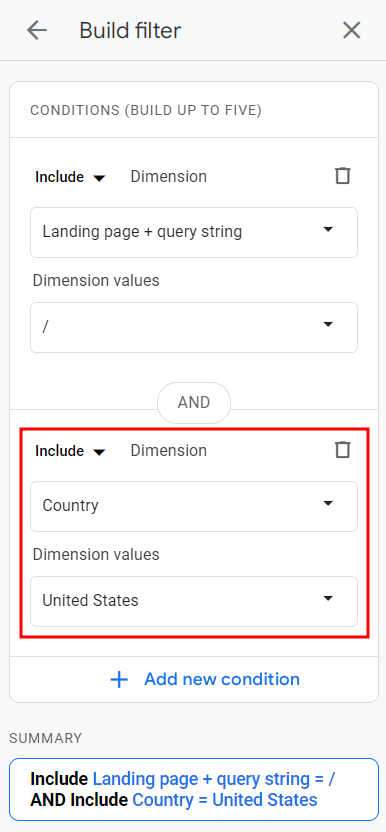
To do that, redo the report filter. First include the landing page, then add a second condition to include or exclude geographical areas. In my example I included only the US traffic, as this website only sales in the US.
Traffic sources
Your landing page might be receiving traffic from multiple sources i.e. a Google Ads campaign that you invested in, search engines, organic social media posts, an email promotion campaign that was sent, etc. Those sources are not equal, and are generating traffic with varying degrees of interest and readiness to sign up to your offer or purchase your new product. It’s important to analyze them separately because the performance of your landing page depends on who the users are. You can’t expect the same results from existing customers who have been signed up to the waiting list for this specific product and from people who never heard of you and clicked on an add while researching the product category.
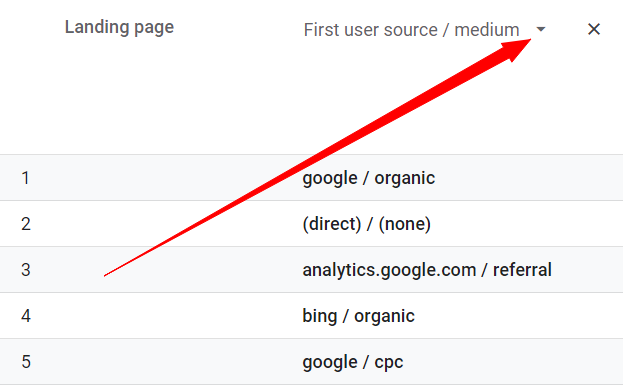
To see your traffic sources apply a secondary dimension of First user source / medium.
Use the Conversion rate and Average engagement time per session to identify traffic sources that perform well and try to scale them up. Check out the traffic sources that are performing poorly and try to make improvements or shift the resources to other initiatives. A low hanging fruit is to evaluate the performance of PPC campaigns, if you are not seeing success take action.
Mobile Devices
You landing page looks very different on desktops, tablets and mobile devices. What you consider the crucial elements of your landing page may all fit perfectly above the fold when viewed on a desktop but might be too many to fit on a mobile screen.
A second difference is that users are not behaving the same way when on mobiles e.g. they may not want to download your PDF guide or case study to read it on their phone.
Many landing pages receive large volumes of traffic from mobile devices but desktops present better numbers in terms of conversions and conversion rates. To analyse your landing page performance the proper way you need to treat desktop and mobile device experience as two different entities.
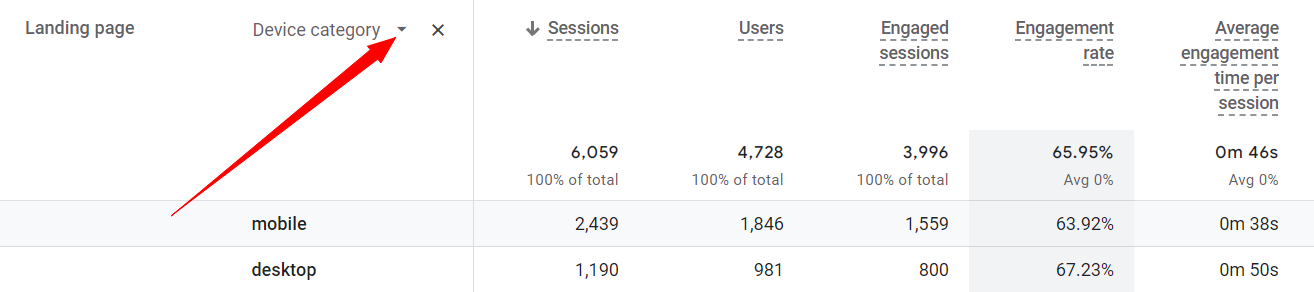
To split you data up use the Device Category as a secondary dimension.
If you want to analyze the device split for just one traffic source e.g. google/cpc, add it to the filter and use the device category as the secondary dimension.
Look at the conversions and conversion rates to identify the the devices with best and worst results. Does this trend repeat across traffic sources? If it does look for improvement opportunities on you page and the conversion funnel. If it’s very pronounced just for one traffic source, look for improvements in the interaction before the users get to the landing page. Check out your ad or Google listing, does the message build the right expectations?
Takeaways
In this article, you saw 6 landing page performance metrics and how to set them up in a GA4 report.
It is crucial to measure the desired actions that you want users to take on the landing page. Set this up as conversions in your GA4
Use metrics that express rates not volumes when drawing comparisons. Use user conversion rate to compare the performance of different campaigns, traffic sources or landing pages.
The performance of a landing page depends not only on the layout, copy and visuals. It greatly depends on who the users are, their intent and the device they are on when they visit your landing page. Make sure to account for that in your analysis by using filters and secondary dimensions.
Leave a Reply