What if I told you that only less than 50% of your website users are your target audience? It may be a shocking statement, but do you really know who is visiting your website?
In this post, I am going to walk you through the reports in Google Analytics 4 (GA4) to show you how to gauge what part of your users is likely to be your target audience. I am also going to discuss how to take action to change it.
Why care?
Here are four questions about your business:
- Is your monthly digital marketing budget working hard for your business or just doing average?
- Are you hitting the right people with your marketing efforts?
- How much of your budget are you wasting every month to get in front of people who will never be your customers?
- What is the first thing the new customers see when they come to your website and does it make sense to them?
If you are like most businesses, you probably don’t know the answers to those questions. The good news is that you can use Google Analytics 4 to get those answers about your business and find the opportunities you aren’t yet aware of.
Table of Content
- The GA4 Users Who Are Your Target Audience
- GA4 analysis of the website users
- Fix large volumes of non-targeted traffic
Let’s explore if your website is working for you as hard as it should!
Estimate the volume of GA4 users who are your target audience
GA4 Users vs your target audience
Target Audience are people who are likely to want your service or product. This is the intended audience you should be targeting with your campaigns and web content.
Users is a metric in GA4 representing the total number of active users who visited your website during the specified time frame.
You may be tempted to assume that the users who visit your website are your total addressable audience and judge the success of your marketing and digital efforts on this metric.
For example, you might be using this metric to calculate your conversion rates, and how users engage with your content. Or you might be using it to report on your traffic and how it grows over time as a measure of the success of your SEO, email, or PPC campaigns.
But this is a mistake.
Users in GA4 are not your target audience by default. In fact, you might be surprised to learn how much of your website’s traffic consists of users who do not represent an opportunity for your business.
In the following steps, we will jump to GA4 reports to estimate what part of all users is likely to be your target audience.
Why estimate the volume of website users who are in your target audience?
Why is this important?
- To identify the real size of your addressable traffic.
- From there, you can assess if you are even getting in front of enough prospects to reach your monthly goals.
- To calculate your conversion rates correctly.
- In other words to be able to know if you are effective enough in turning your leads into customers
- To judge your performance based on the right indicators.
- Let’s say you are observing a steady increase in website visitors. But is this increase due to growth in high-quality visitors likely to be your real audience?
Define your target audience
Let’s start with your target audience. Does your business have its target audience figured out? If you do, bring up your file.
For this analysis, we are looking to analyze the differentiators of your target audience that are related to data collected in GA4 standard reports. GA4 offers, among others, reports useful if your target audience can be differentiated by location, gender, age, and to a lesser extent by a professional role or a pain point.
If you don’t have your target audience figured out, consider these ideas.
Geolocation:
Are your customers located in a specific geo area like a country, a state, or a city?
The answer is likely yes if you are:
- an e-commerce store selling only in the US, or just one specific country.
- a local business serving a city or town-based area e.g. a dentist, or a law firm.
- a national business that doesn’t provide services to customers in other countries.
- a business that targets selected areas, states, countries, etc.
Geolocation is a very important criterion in this analysis because many businesses don’t and can’t sell beyond a certain geography. People from other locations will just never be their customers even if they can access the website, review the products or send a form. Geolocation is more restrictive than other factors in our analysis such as gender, age, or professional role. For example, a business might target a certain age group but every now and then a person from outside the targeted age group might become a customer.
Demographics: Gender and Age
Is your business selling services or products that are of interest to one gender only? Do your products or services serve only specific age demographics?
Demographics may be a less clear-cut differentiator than location because there is a high chance a transaction or service will take place even if the customer is not exactly in your targeted demographic.
Some businesses might target audiences based on gender and/or age. However, a target audience doesn’t have to be both gender and age-based, some businesses might target an age-based demographic only while others will concentrate on gender only.
Bear in mind, it’s not uncommon for a business to target an audience that is gender-neutral meaning gender is not a differentiating factor of who their customers are.
Other businesses might have two or multiple personas each based on a different demographic. For example, a wedding tuxedo rental business might have a male persona representing the groom who is shopping for his wedding outfit. But it can also have a female persona representing the bride who is often invested in the choice of the groom’s outfit and is in charge of the decision process.
Choose the gender and age-based target audience if your business’s customer base is clearly differentiated by gender, age, or both. If gender or age are not differentiators for your customer group, you can look for other characteristics.
Professional role or a Pain Point
Are your products or services addressed to people with a specific professional role or responsible for a certain task in their workplace?
Do your products or services solve a specific pain point for people?
The example for this analysis
I will be using the Google Analytics 4 Demo account that represents data collected from their Merchandise Store website. It’s an e-commerce website that sells Google-branded merchandise.
For the sake of this analysis, I needed to come up with a target audience for this website; the audience is fictitious because we don’t really know who Google is targeting.
I noticed the website features a US store and a Canada store so I am assuming the products can only be purchased and delivered to those two countries. I will also assume the target audience is made up mostly of men between 20 and 40 years old, this will come in handy to show you how to make this analysis if your target audience is gender or age-based.
An example target audience for Google Merchandise Store:
Geo Location: based in the US or Canada.
Demography: male, 20-40 years old.
Professional Role: specialist or lower-level management staff in a company with a focus on tech or digital space
Interests: IT tech enthusiast, Google fan
GA4 analysis of the website users
#1: Users Count and Users Overview
#1.1 Users Count
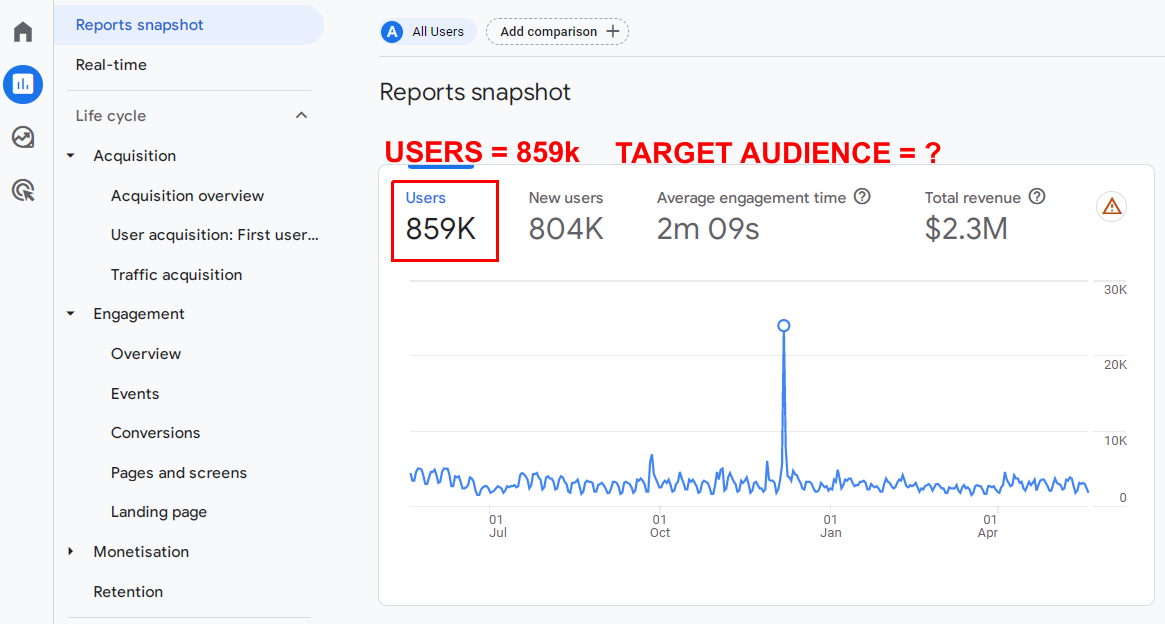
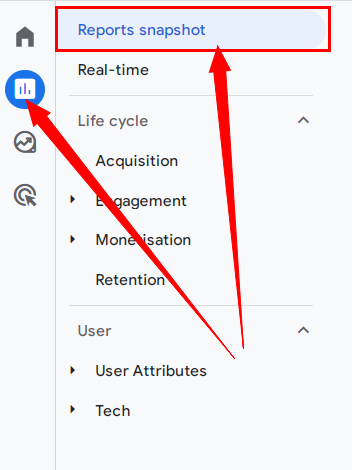
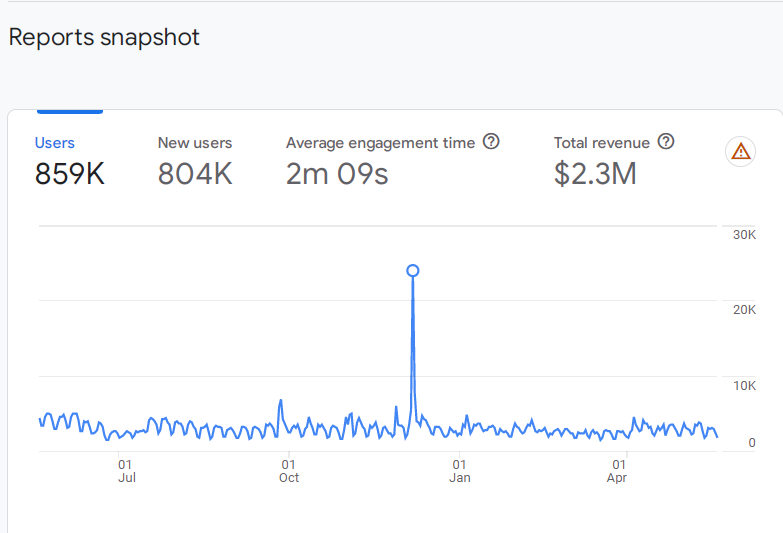
Go to Reports > Reports Snapshot to see the volume of users who visited your website in a given time.
Take note of the user count. 859K Users for our example.
#1.2. Users Overview
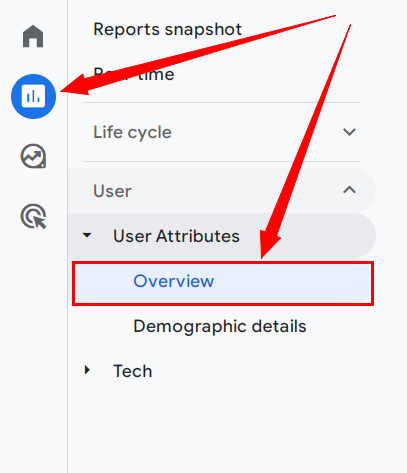
Next, to get an overview of who your users are, go to Reports > User > User attributes > Overview
You will not see any data in cards for Users by Gender, Age, or Interests if you haven’t enabled Google Signals. Before you enable this setting make sure you have read and understood the implications that come with it. More information here.
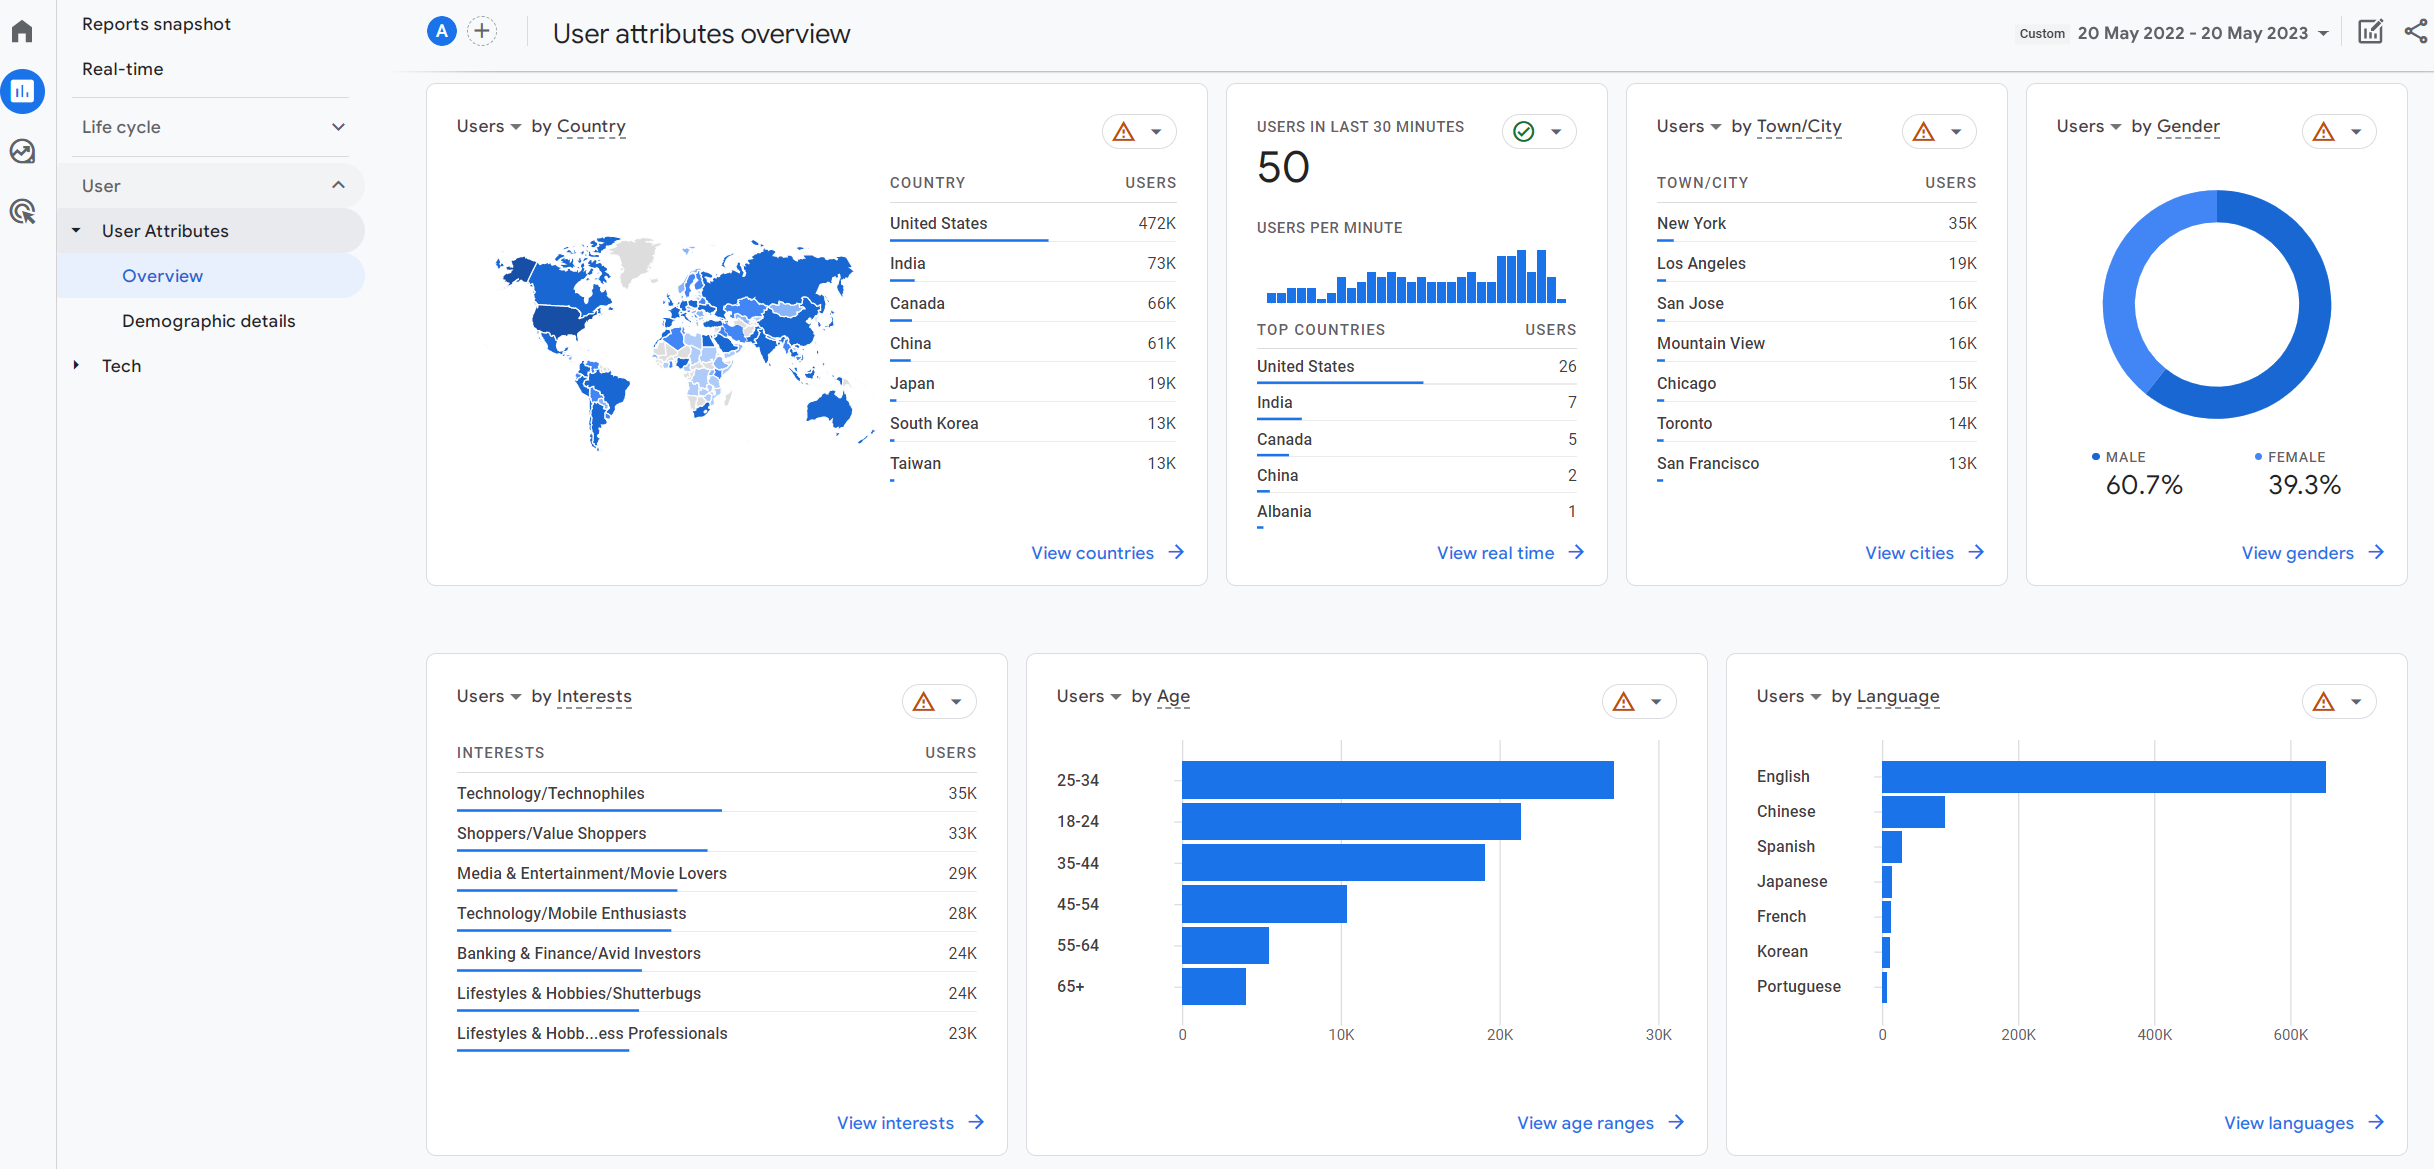
Right away, I get the idea that many users are not exactly people in the target group. I can see that people who visit this website come from multiple countries not just the US and Canada. I can also see only around 61% of users are men. Let’s dive deeper into the specific reports to estimate how many of those users are in our target audience.
# 2 Users Geolocation
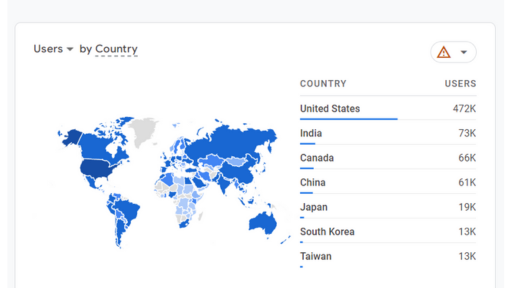
# 2.1. Users by Country report
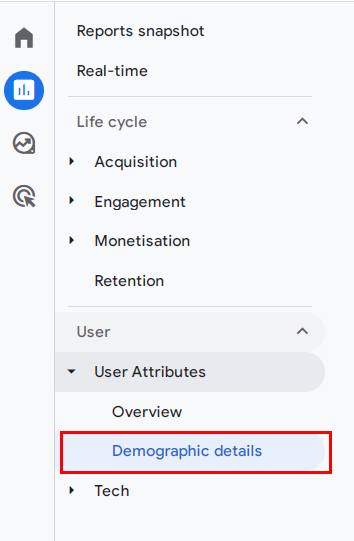
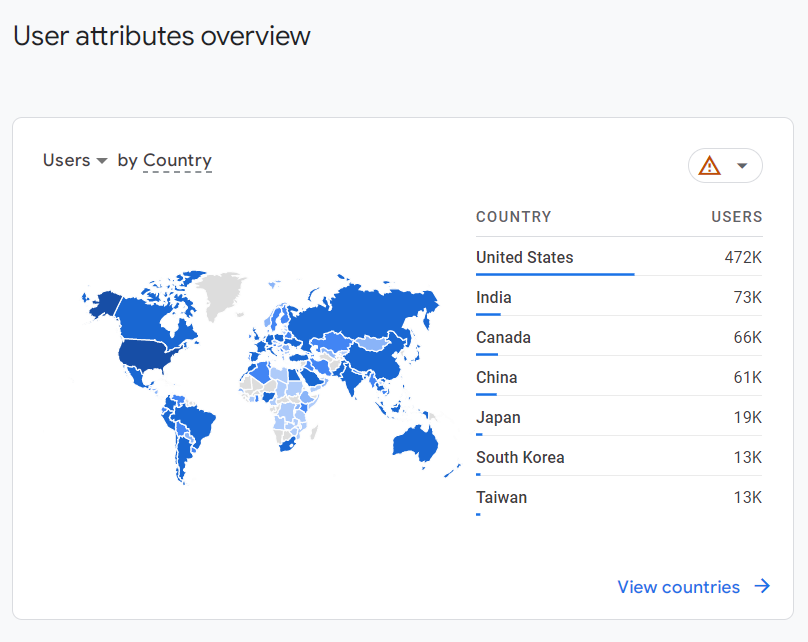
Go to Reports > User > User attributes > Demographic details
This report has Country as the default dimension.
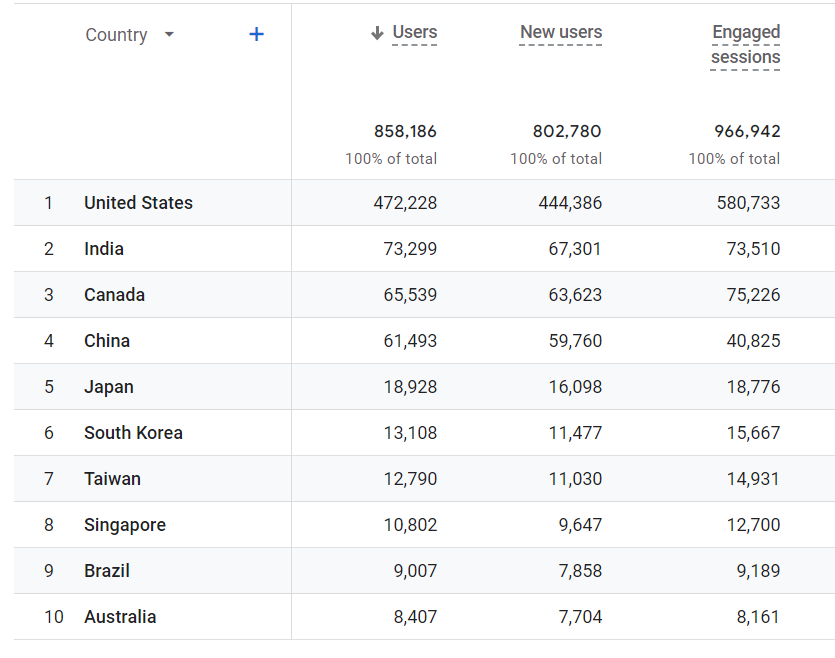
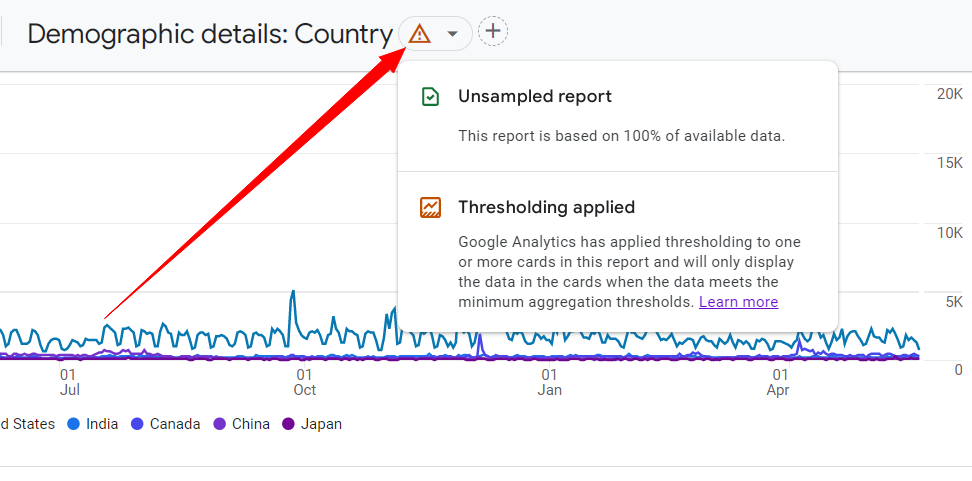
I can see many countries with substantial volumes of users including the US and Canada which are the targeted countries. However, the business doesn’t sell and ship to territories like India, China, and Japan which all present large volumes of users.
A side note on the users count: The users in this report sum up to 858,186 and not 859K as seen in the Report Snapshot in #1.1. This is because this report has thresholding applied. To learn more about the data thresholds see here. What it means for us when running an analysis is that we need to adjust our expectations as the numbers between reports will never be matching 100%.
#2.2 Users by Town/City or Region
If your business is local, use the arrow next to Country and pick Town/City or Region (use this for a state).
#2.3 Compare all users to users in the desired territories
To gauge the size of my addressable audience I am going to compare all users in this report to the Users from my desired countries.
In your report, click Add comparison at the top, then specify your desired territory. I am choosing Country, then checking US and Canada, but in your case, it may be a Region or a Town/City.
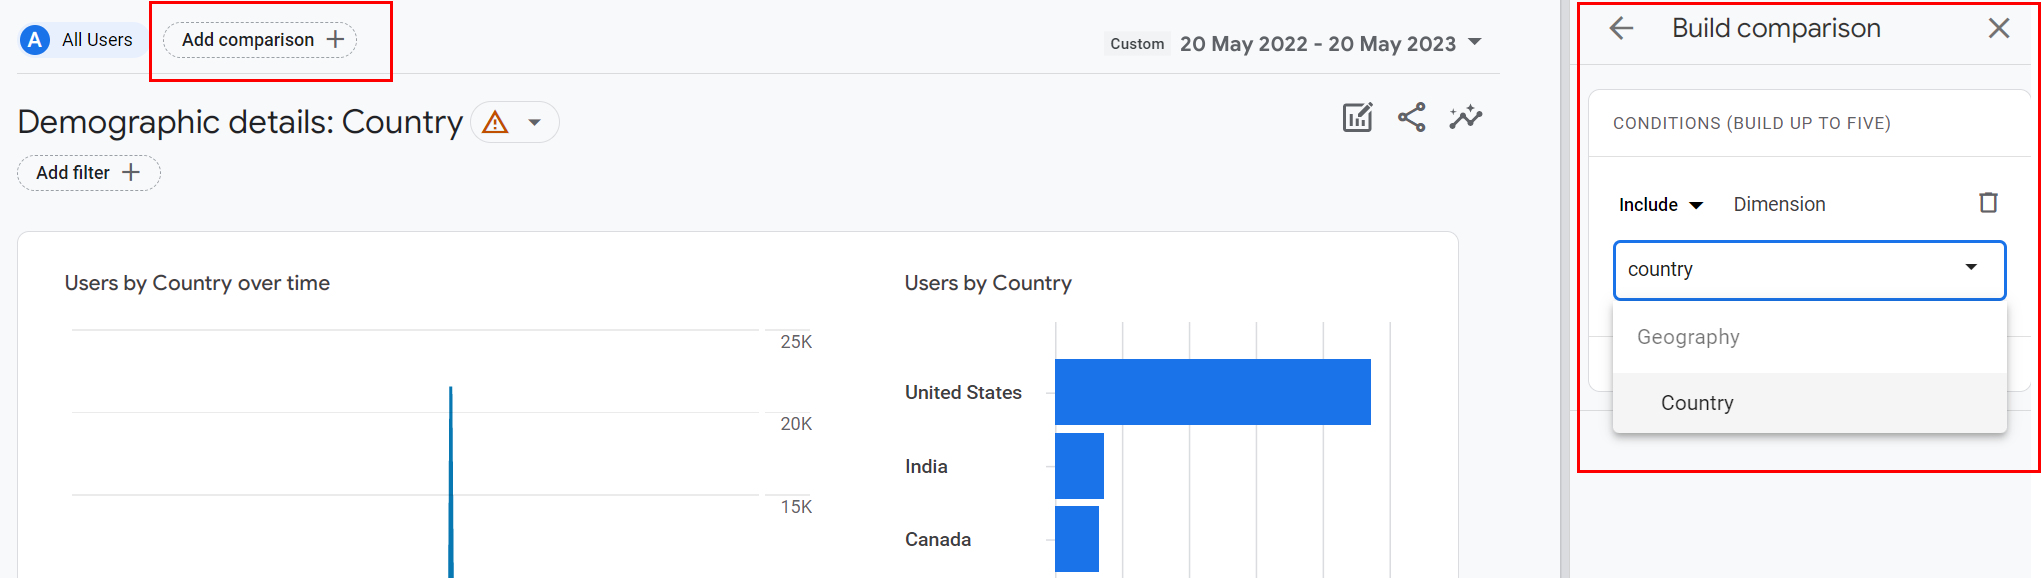
Once you selected your targeted geography hit Apply.
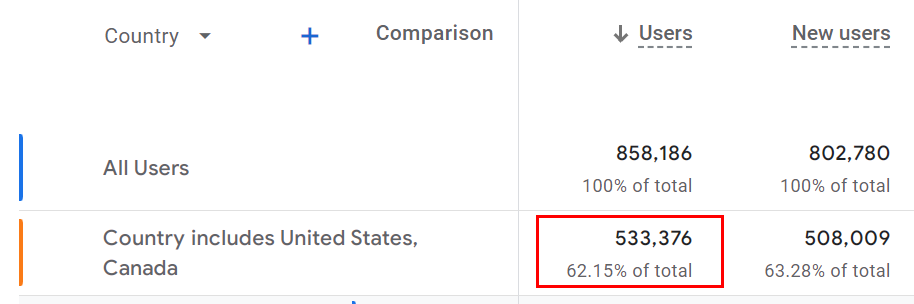
Only 62,15% of users coming to the website are from the targeted territories.
This is a huge difference. And this audience does not yet reflect the demographic differentiators.
#3 Gender and Age
#3.1. Unknown in Users by Gender and Age reports
Let’s remove the comparison and change the dimension to Gender
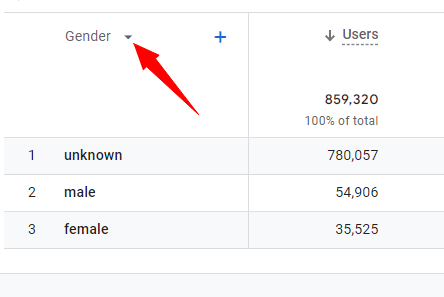
Now we are seeing this report which shows gender data for all locations.
We can see that most of the users are categorized as unknown gender.
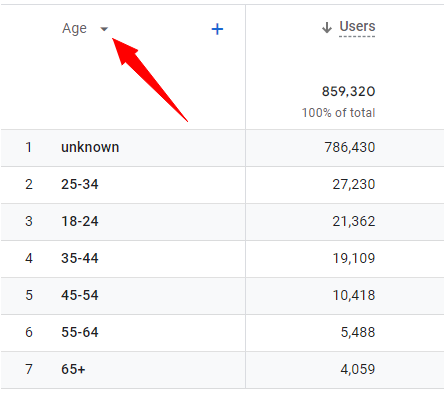
We get a similar case for the Age report, most of the users’ age is unknown.
This is because Google can only collect and identify gender and age data of a part of total traffic. As a result, a big portion is marked as unknown. Unknown are users that Google was not able to collect this information on for example because they don’t have a Google account. Unknown doesn’t mean the users who don’t identify with the binary labels.
As a side note: at this moment, Google is only showing gender data categorized as unknown, female, and male. Other gender labels are not reflected in the reports, even though Google collects a selection of gender-related labels for new users during the Google account creation process. It will be very interesting to observe how Google will approach the question of gender labels in demographic reports in the nearest future.
Because a large part of the data in gender and age reports is inconclusive (unknown), it is not going to be as useful to us as the geolocation report. We will look at the data here with a grain of salt. Let’s think of this as gauging the trends rather than getting an accurate number.
#3.2. Range of users within the target gender and age demographic group
So one way we can apply gender and age data to calculate our target audience size is to figure out a range for our target audience of males aged 20-40 y.o.
To get the minimum values, first, let’s apply a geography filter to our report. Click Add filter.
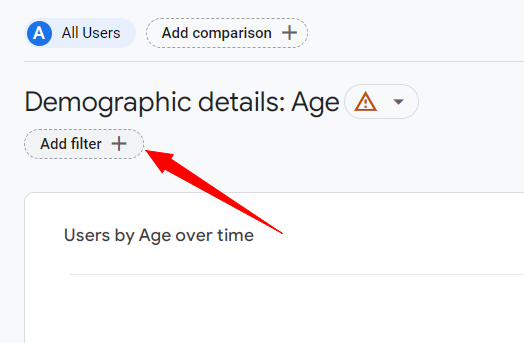
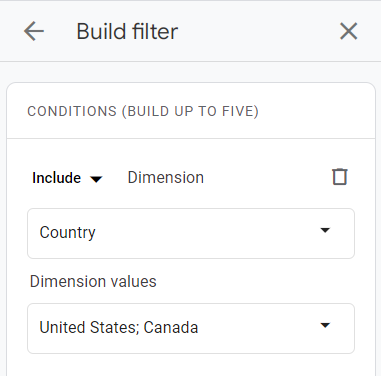
Now, only include users from the desired countries, in my case, it’s US and Canada.
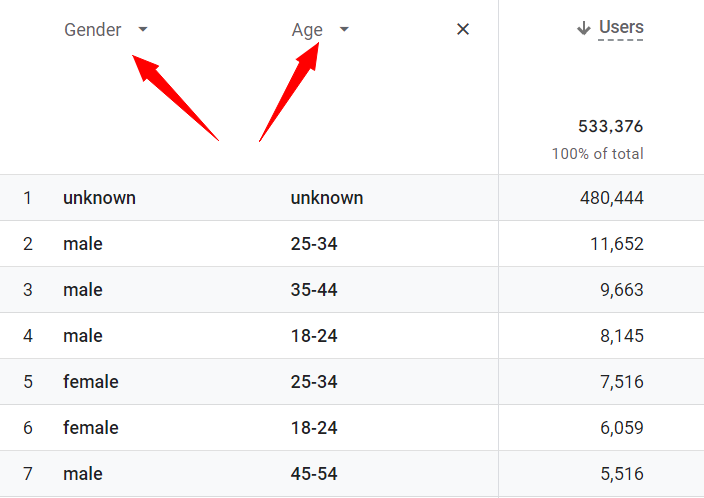
And lastly, let’s set Gender and Age as our primary and secondary dimensions.
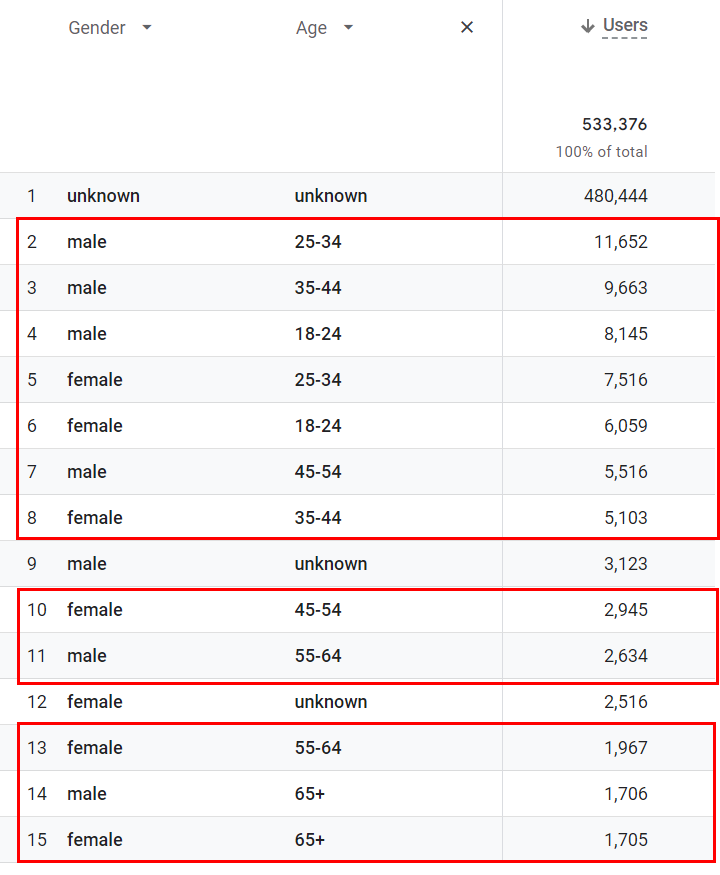
First, we can see that Google provides our age data split into 6 age groups plus the unknown. The age groups are:
- 18-24
- 25-34
- 35-44
- 45-54
- 55-64
- 65+
This means that we can’t just apply the age ranges that we have in mind for our target audience, instead, we need to go with what Google gives us.
In my case, instead of the 20-40 range, I am going to need to stick to 18-24, 25-34, and 35-44 for my analysis.
Notice there is no category for users under 18, so we assume these users are grouped under unknown.
To get the minimum size I’ll sum up the values for males and 18-24, 25-34, and 35-44.
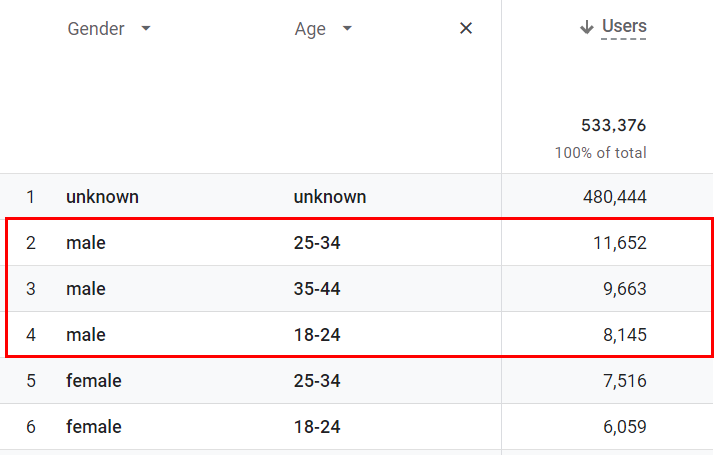
My final minimum count for users within my demographic and geography criteria is 8,145 + 11,652 + 9,663 = 29,460
For the maximum count of the range, we need to assume that unknown users can be a part of our target audience.
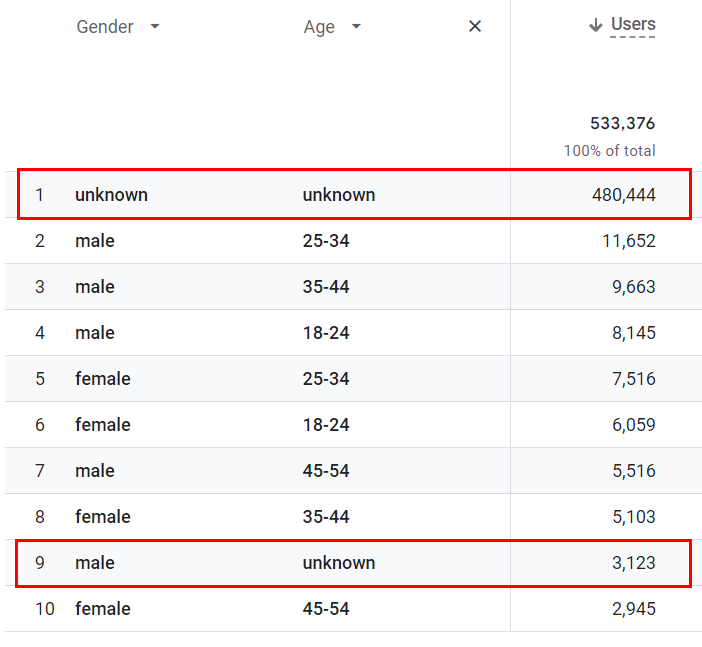
We will just add the values for the unknown gender unknown age 480,444 and male unknown age 3,123 to our minimum count of 29,460 .
Our maximum count is 513,027.
So we went from 859,000 total active users in GA4 Reports Snapshot to a range of between 29,460 and 483,567.
That’s between 3.4% and 59.7%
#3.3 Proportion of known users
What if we could get more specific and narrow this number down?
Another way we can spin this information in GA4 to get to an estimate is if we take the percentage of all known users who are male and fall into the ages of 18-44 and extrapolate it to the unknown part of the data. In other words, we would be assuming that the proportions we are seeing in the known users can be applied to the unknown users.
For my example, I need to calculate the total of users within my targeted geography and with known gender and age and figure out what part of that total are males 18-44 y.o. based in US or Canada.
Users within my targeted geography and with known gender and age = 47,293
Males 18-44 y.o. based in US or Canada = 29,460
Males 18-44 y.o. based in US or Canada represent 62,3% of users within my targeted geography and with known gender and age.
Now let’s extrapolate this proportion to the unknown users (in our desired geography).
The unknown users’ count is 486,079.
How much is 62,3% of 486,079?
62,3% of 486,079 is 302,827.217. After rounding we get 302,827 users.
So the estimated number of males 18-44 y.o. in this entire set is 29,460 (known set) + 302,827 (unknown set) = 332,287
In other words, out of the initial count of 859k users, we estimated that only 332,287 are within our geo and demo target which is only 38.7%
#4 A target audience not based on a gender and age differentiator
What if your audience is not gender or age-based?
Another way of gauging if you are getting in front of your target audience with your website is by examining the type of content your users land on when they first get to your website.
This exercise might be especially useful to businesses that do not have personas based on gender and age criteria. If your target audience is more likely to be based on a professional role or a problem they are trying to solve then this method might be more helpful to you.
If you are doing things right, chances are your top landing pages should be those that contain information highly relevant to your target audience and/or the problem they are trying to solve. To figure it out we will examine the following:
- What pages on your website do most people land on (top landing pages).
- How do people get to those pages.
- How relevant do people judge the landing page to be for their situation.
To uncover those 3 insights we need to create an Exploration report.
#4.1. Create a custom Landing Page report
Click on Explore and choose a Blank report.
Next, under DIMENSIONS add Landing Page + query string and First User source / medium. Under METRICS add Sessions, Average engagement time per session, and if you are an e-commerce website you can optionally add e-commerce purchases and Purchase revenue.
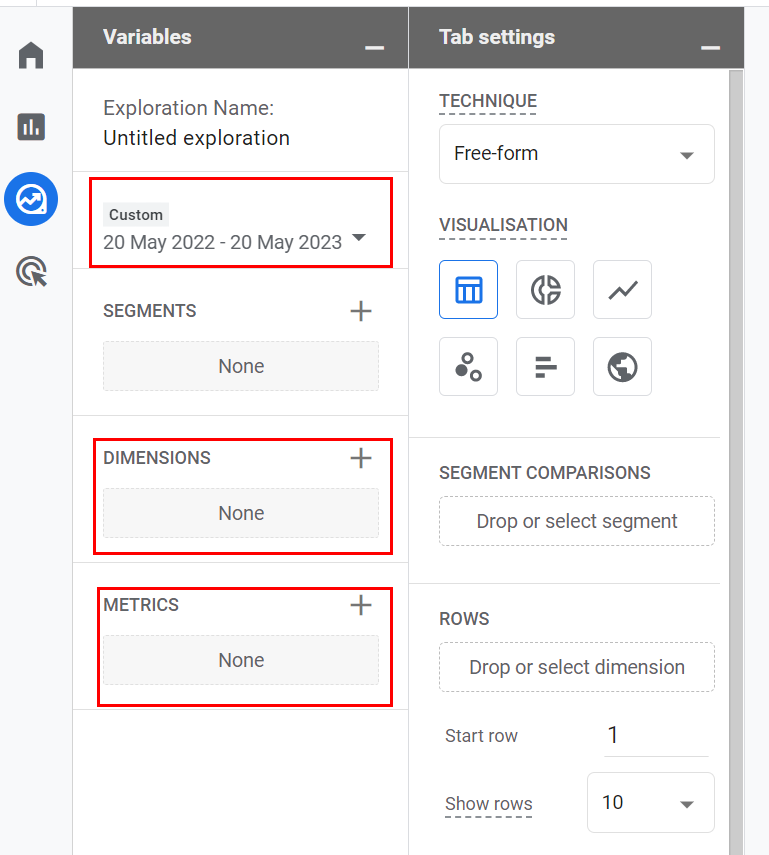
Drag the dimensions to ROWS and metrics to VALUES and start answering the 3 questions.
#4.2 Not set and empty values
Before you start analyzing, you are likely to see rows “not set” or empty in your report.
These are likely reflecting errors or lack of information in your tracking, some of which can be fixed. If in your case those are representing very high volumes you might want to look into ways to eliminate those issues. For more information look here.
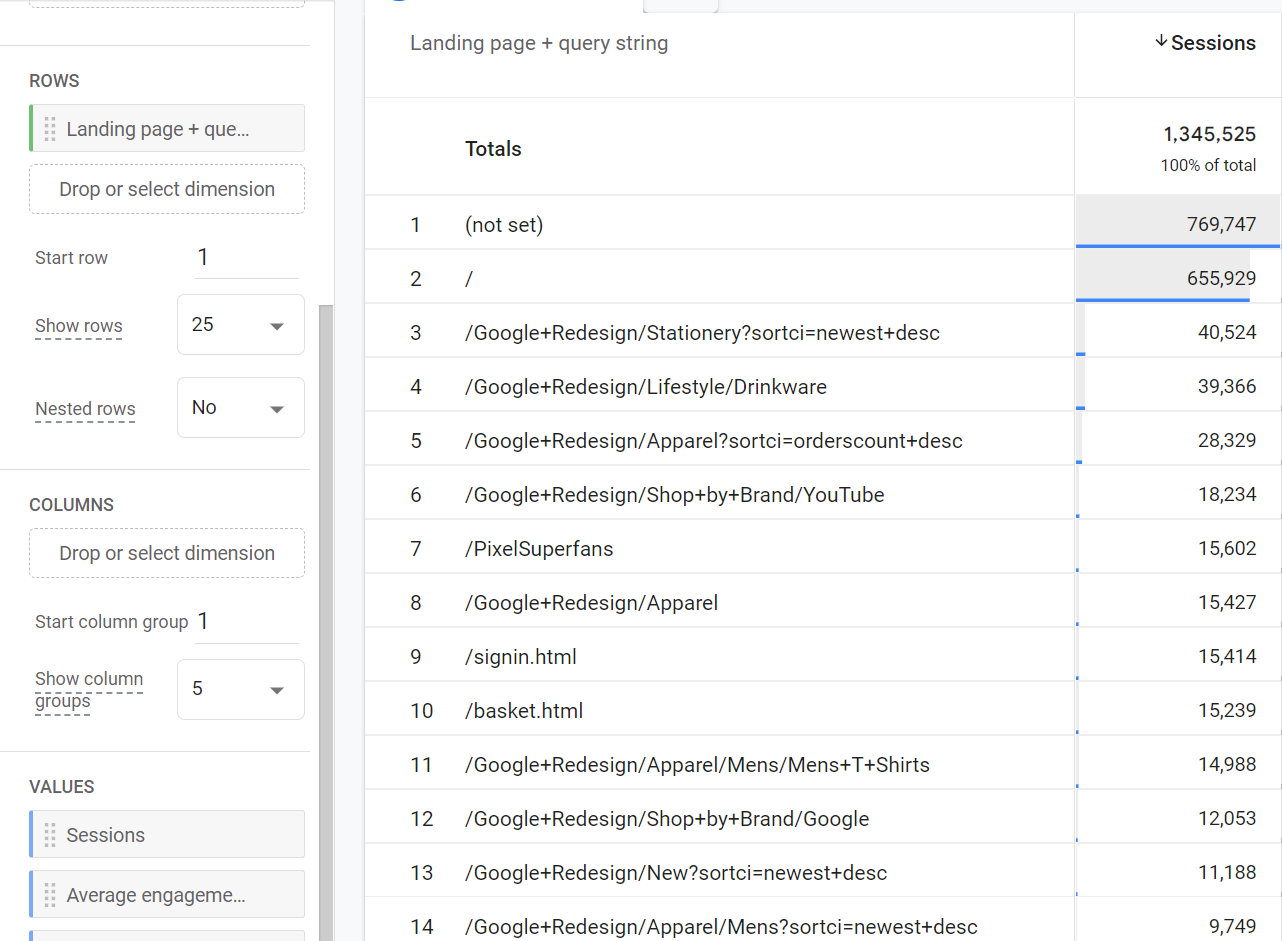
#4.3 ANALYZE What pages on your website do most people land on
Check the report sorting and if it’s not set to Sessions in descending order click on the arrow next to Sessions to set it so.
Examine the top 10 to 20 landing pages. If you are not sure what’s on those pages, open them in a browser and check what’s there. Do these pages represent content highly relevant to your target audience and what they might be looking for? Do you think these pages are the top pages you would like the users to see on their first visit to your website?
Look for any pages that are not likely to be your top useful content, things as:
– pages with content that your target audience is unlikely to search for, or with content that is likely to be attractive to people who are not your target audience
– outdated blog pages that are not very useful to your target audience,
– pages showing an old product that you no longer sell, services that you no longer provide or do not wish to promote
– thank you pages or other internal pages that should not be a first step in someone’s session on your website
– any other page that you feel very surprised to find among the top landing pages such as a random product that’s not very popular, or a random blog post published many years ago, etc.
If you are seeing such page receiving large amounts of traffic from your first-time visitors then you know that you might not be getting in front of the audience you are targeting.
For example, your website might be receiving high volumes of traffic to the thank you page that shows after a contact form is submitted on your website. But you may discover that the reason is that this page is ranking high on Google when people search for “example design layout for a thank you page”. People likely to be searching for these terms are web designers, web design marketers, etc.
In one of the websites I analyzed, I found one of the top 3 landing pages was a blog post addressing a very generic question that didn’t relate to the target audience in any special way. This question would be important for people traveling abroad by car at a specific time of the day, while the target audience for that company were business executives. On top of that, this page didn’t answer that question in a very specific way.
During a closer examination, I found that those large amounts of visitors were finding this page from Google organic search because it had high rankings on Google for this generic question. I knew that those searchers were not in the market for what this business was selling and I felt that including this traffic in any analytics reports or analysis was not useful. You don’t want to calculate your conversion rates based on a large number of users who are not going to become your clients.
If you identified such pages among your top landing pages you can use this report to gauge what part of your traffic is not your target audience.
#4.4 How do people Land On off-target pages on your website
To find the root cause of why such an off-target page might attract high levels of traffic, create a filter with this landing page and use First source/medium as the ROWS.
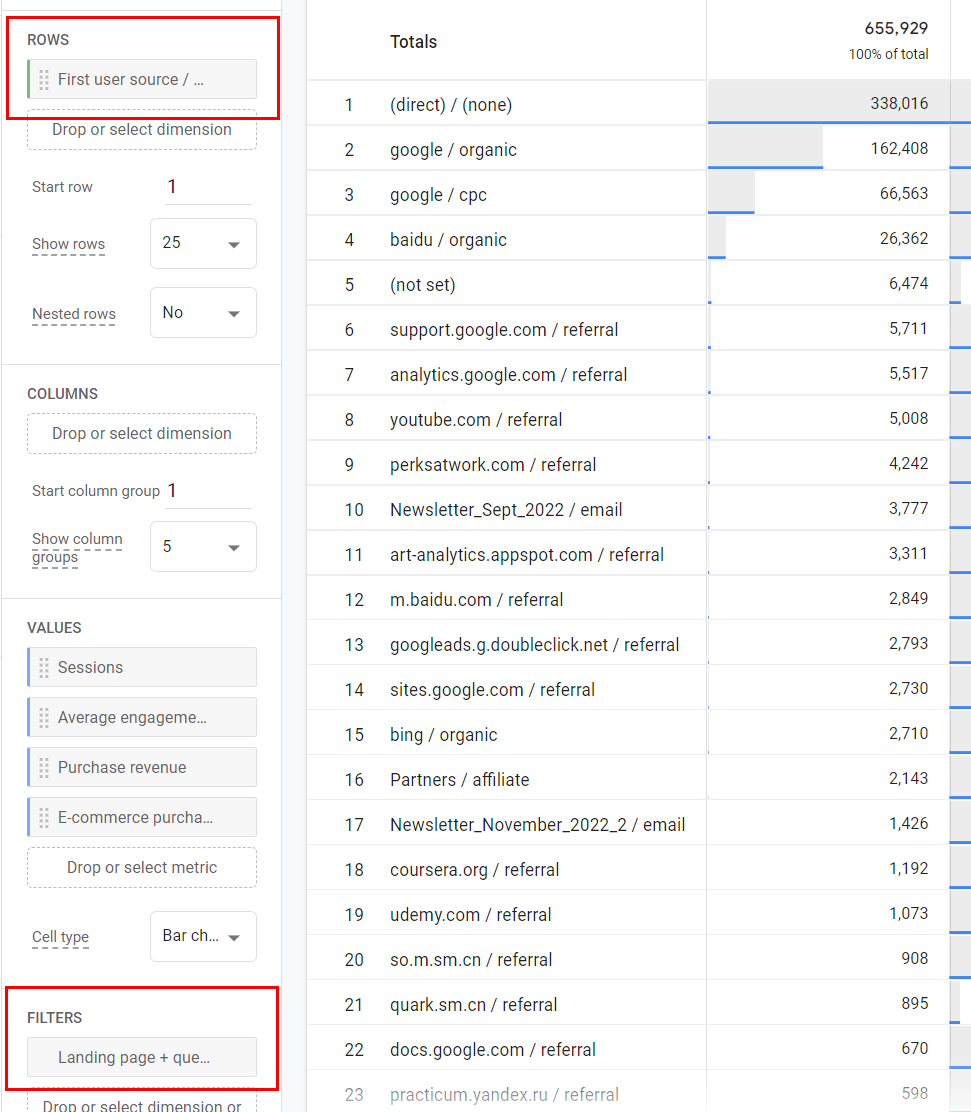
This will help you discover what is driving people to this page. It may be a failed PPC campaign, a referral from another page, or the organic medium driving users from a search query that this page is ranking for exceptionally well in a search engine.
#4.5 How relevant people judge Your landing page to be to their situation
If one of your top landing pages gets very little engagement it is another red flag. Even if the page is of good quality and relevant to your target audience the low engagement shows people don’t find it useful. This may mean that either the users who find it are not your target audience or there is a mismatch between their intent and the page’s content. For example, you might be running a PPC campaign that is attracting users who need to learn more about your innovative solution before making a decision but instead, you are sending them to a sales landing page with little information.
To check the engagement of your top landing pages in your custom landing page report pick Landing Page + query string as your ROWS.
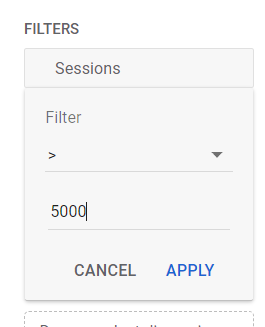
Apply a session count filter. Pick a number that would allow you to include between 10-20 of your top pages, in my case, it’s 5000. Hit Apply.
Use the arrow next to the Average engagement time per session metric to sort the report in ascending order of time per session.
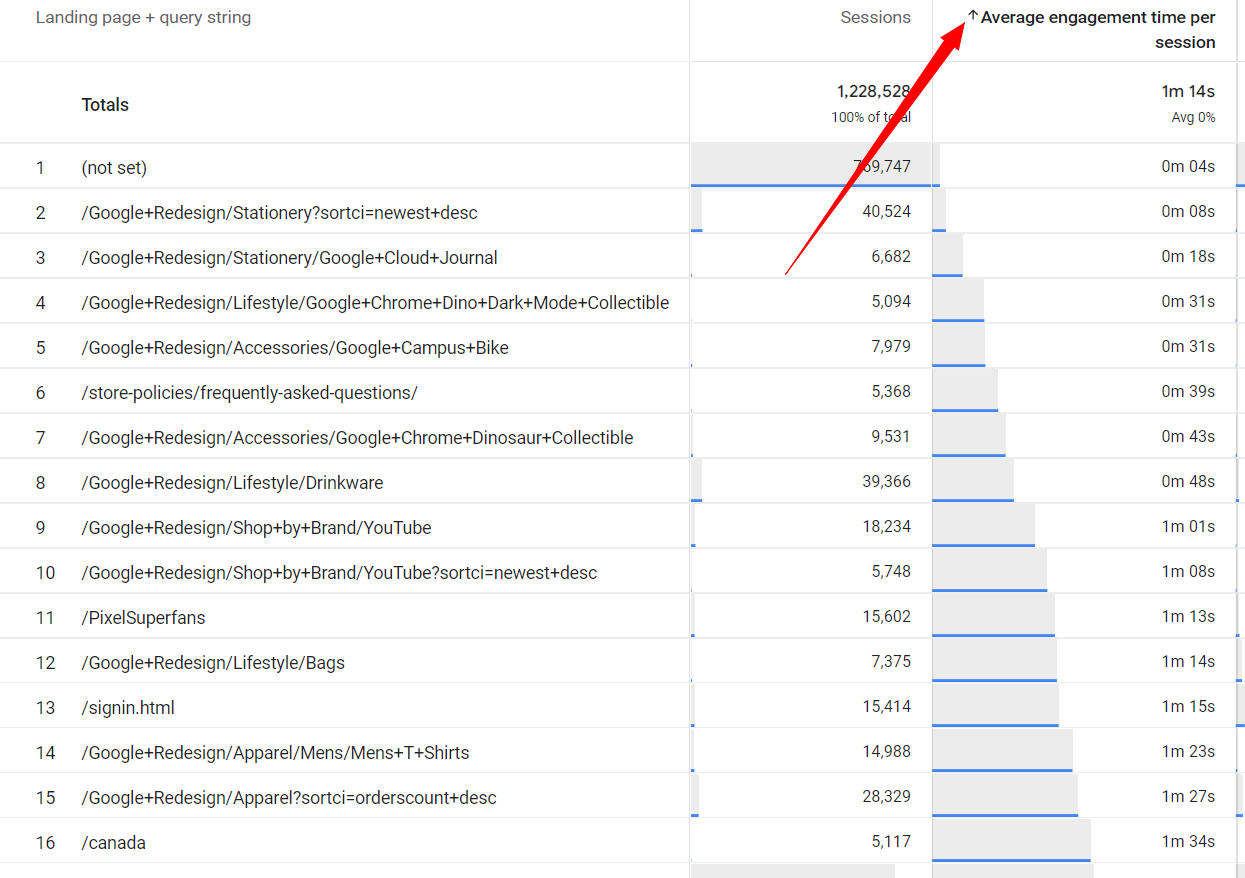
Are you seeing pages with an engagement time below 10-20 seconds? These pages drive high volumes of traffic to your website but this traffic is not engaged. It may show a tracking error or that users expect to find something else on those pages.
You can add a secondary dimension of First user source / medium to identify what brings people to those pages.
We have now concluded the analysis which revealed large volumes of untargeted traffic. Let’s look at a few ideas on what we can learn from this discovery and how to address this situation.
What to do about the large volumes of untargeted traffic
Have you discovered that most of your users are not people who you are targeting?
Here’s what to do next in each of the covered cases
Track it
First of all, keep track of your target audience in GA4.
You can build an Exploration report with your desired filters and save it for your review at any time. Filters in Exploration accept regex matches and you will be able to include unknown values for gender and age if you want to track it.
If you don’t want to track the unknown values you have other options such as creating a segment in the exploration report or even creating a filter in a standard report and saving the link to the report that you can generate via the Share feature.
This way you will be able to assess the situation over time, check if your improvement attempts have had an impact on the traffic, and see all your important metrics for your target audience only.
Now that you know how to track your high-value traffic let’s see how we can fix things.
Assess the damage
Consider the impact of untargeted traffic on your website and your business operations. When you discover more than 50% of your website’s users are not people you want to target your first impulse might be to drop everything and fix, fix, fix. But the undesired traffic coming to your website doesn’t have to be detrimental.
Ask yourself the questions: What am I losing when the untargeted traffic is visiting my website in large volumes?
Am I paying to bring them to the website?
Am I wasting resources attending to their forms, chat messages, and calls?
If the answer is yes then you should take action.
But if the undesired traffic is not generating extra costs or work for your business, then it is best to first put your resources into attracting more high-quality traffic and then worry about the undesired traffic. Some ideas to generate more high-quality traffic are:
- the right audience targeting settings in PPC campaigns
- great ad creative and the right messaging in your PPC campaigns
- great content that’s useful to your target audience in your SEO or email campaigns
Address the damage
If you decided you need to address the undesired traffic because it’s generating losses then here are two things you can do to change the situation:
- You can decrease the volumes of those users coming to your website
- You can put up messages on your website early into their visit to inform them your product or service is not intended for them.
The first solution is the way to go if you are currently paying to bring those users to your website.
The second solution is to prevent those users from generating work for your business and unnecessarily consuming your resources.
Let’s dive into some specifics.
Wrong geography
If you are seeing a high volume of users from the territories you are not targeting here is what you can do.
Discover why those users are coming to your website in such high volumes.
Identify a few untargeted territories that contribute most to the volume of traffic.
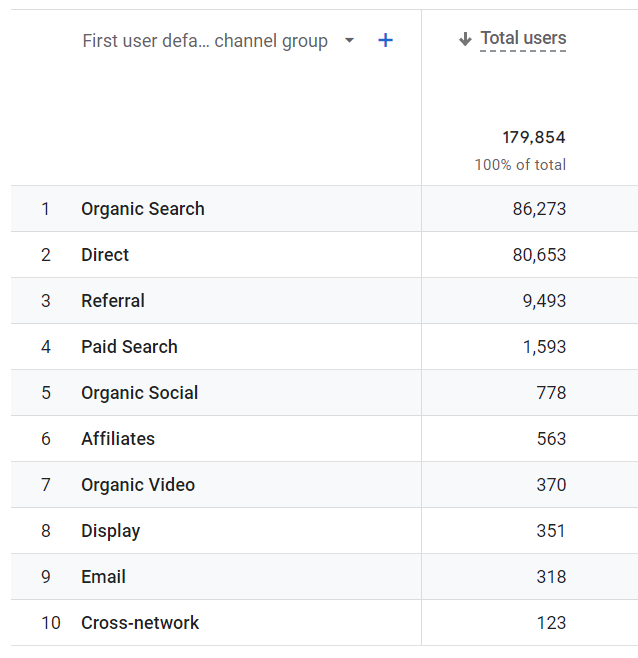
Then, go to Reports > Acquisition > User acquisition. Apply a filter and include the options that you identified. In my case, it’s India, China, Japan, South Korea, and Taiwan.
PPC
If you are seeing traffic coming from paid channels such as Paid Social, Paid Display, Paid Search, Cross-Network, etc then correct the settings in your PPC campaigns. Don’t pay to show ads to people in the territories you are not targeting and not serving. It may be a bit more complicated if you are a local business serving users in specific smaller areas such as a town or a zip code. In this case, the standard practice is to include the service location in the ad headline or ad copy.
Email and SMS
If you are seeing lots of traffic coming from email or SMS campaigns reconsider your targeting. It may be that you are paying your email provider to keep tens of thousands of contacts that will never become your clients because you don’t sell to their regions.
You can segment your list by location and nurture only the contacts from your desired territories.
In the future, you can also try and control who signs up on your list. For example use software to display your lead magnets, and SMS and newsletter signup opt-ins only to visitors coming from your desired geo areas.
Organic
If your undesired traffic is coming via search engine results you can try these ideas. Use the landing page report with the geography and channel filters to discover which page or pages are driving those users to your website. Apply a comparison reflecting the desired and the undesired geographical areas. Look at the top pages – are there any pages popular in the untargeted areas but not popular in your target areas? Is this an important page or an odd page that was picked up by the search engines and is now ranking for phrases that are not that relevant to what you do? If so, examine the page and decide whether you need it at all.
If however most of your pages in this report are your important pages and have success in both the territories that you target and those that you don’t target, see if it makes sense to adjust the content and the title tag on this page to reflect the locations that you serve.
However, as with the organic results you may often find that there is not much you can do to limit the traffic from the unwanted geo areas. In this case, you can show a message on your website letting people know which areas you serve.
Direct
Direct traffic are users who landed on your website by typing your website’s address in the browser or by running a link that Google can’t attribute to any other channel. Learn how to tag all of your conscious traffic acquisition activities so that you can differentiate this traffic in Google Analytics. Tag your email campaigns, ads, or any link campaigns that you are running.
Examine the landing pages for that channel from the untargeted geographies. See if there is any unexpected page there.
If you are a popular brand direct you are likely going to see lots of direct traffic.
Wrong gender and age
If you are seeing a high volume of users with genders and age ranges you are not targeting, here is what you can do:
Investigate their impact on your goals.
Check conversions – are those groups generating results for your business?
Go to Reports > User > User attributes > Demographic details
Apply Gender and Age as the primary and secondary dimensions and sort descending by Total revenue or Conversions
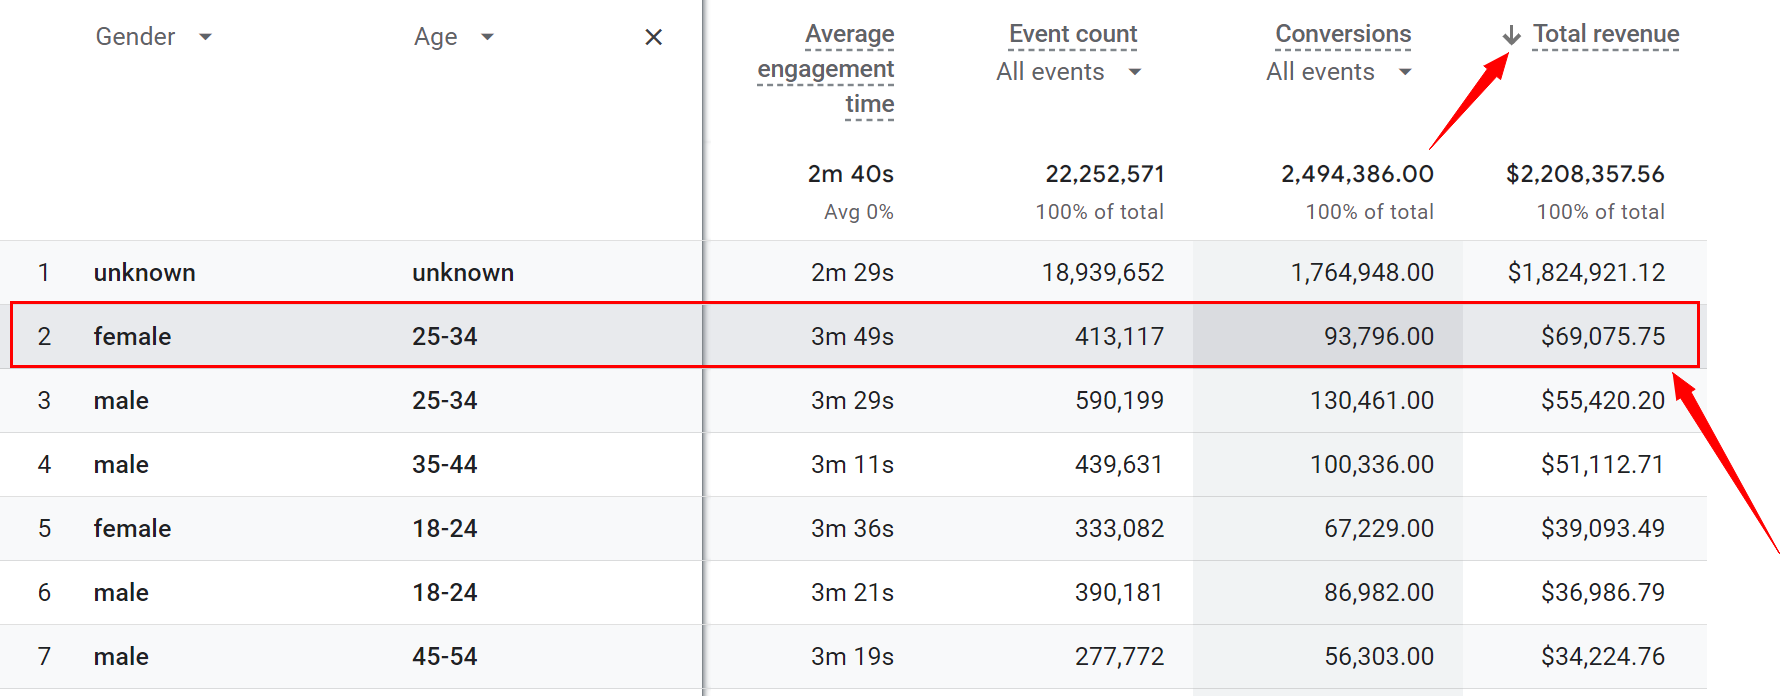
If you are seeing high volumes of conversions from the demographic groups that you aren’t targeting you should reconsider who is your target group.
If this is unexpected to you and you are surprised to see that a group you are not targeting is bringing in such good results, do some user research. Examine what is driving them and what they need your product, service, or content for. See if you can explore this opportunity further by creating a relevant marketing campaign for them.
If however, you are not seeing good results coming from them, find out what is driving them to the website such as which channels and organic keywords.
If it’s paid channels, adjust your gender and age targeting settings. Also, inspect your ad copy, see if you can add any modifiers, and describe the product feature in a way that will clearly show the non-targeted groups that your service or product is not for them.
If it’s the organic search channel, look for any specific page that is driving unwanted demographics to the page. Check the keywords they are using to get there. If you see the keywords are irrelevant to your business, you can try to adjust the copy and the title tags to use the words your target group is using when they search for your products, service, or business.
If you can’t find a way to effectively scale down the volume of users from outside your targeted demographics, you may choose instead to adjust the content on your website in a bid to prevent them from sending you inquiries, calling your business, etc. This will make the users aware your products or services are a match for a different demographic.
For example, you can work with the images and copy to deliver content targeted to your desired audiences. Use images representing the people you are targeting (gender, age, and other attributes that can be expressed visually i.e. parenthood, professional role), when they use your product or service, state who your product or service is for, name your target audience, etc.
Top Landing Pages
You found that some of your most popular landing pages drive lots of poor-quality traffic that is not engaging with your pages or converting. The pages represent content that is generic, outdated, poor quality, or off-target to your intended audience. Examine the source channels.
If it’s a paid, organic social, email, and SMS channels, reevaluate the use of this page as the landing page for the campaign, post, or message. Review the messaging that people see pre-click. If you are hitting the right audience with your ads, posts, emails, or SMS campaign, make sure the pre-click expectation you are building is reflected on the landing page. If you are urging them to buy in your ad don’t show a page that explains the basic reasons why chose your product. If you are urging people to learn about your service in the ad don’t take them to a page that only has a contact form.
If it’s the organic search, then review why this page is ranking so high. Review the keywords and asses if these might be the searches your target audience is likely to be making. If not, consider taking this page down or adjusting the title tag and the content to nurture a pain point your audience has.
Takeaways:
- We reviewed how your website might be attracting high volumes of traffic that is off-target to your business
- The off-target users might be coming from locations you don’t serve, demographics you are not targeting, or simply aren’t facing the problems your business solves for people.
- You now know how to use GA4 to identify the unwanted users and stop counting them towards your important KPIs such as conversion rate, engagement with your content, increase in traffic, etc.
- You now know how to gauge the volumes of the non-targeted audiences and discover the sources of this traffic
- You also learned how to approach the situation, how to find if you are spending a marketing budget to bring the wrong audiences to your website
- Before you spend resources to fix this situation, first assess if it’s generating direct costs or a waste of resources. If it’s not, spend your budget first on increasing the volumes of the targeted audience and only then look to decrease the volumes of off-target audiences.
- If your situation requires fixes, we reviewed fix ideas depending on the type and the source of the off-target traffic.
Leave a Reply