
You’d think: “I check out my website multiple times a day/week, I would know if something major was not working, right?” Wrong!
Did you know your website might present critical bugs that kill your conversion funnel but only show on certain browser versions or devices? Page not loading, form missing the submission button, page not scrolling, navigation not dropping out, images not displaying, or a huge interstitial larger than the screen that cannot be exed out are just a few of the bugs examples that prevent users from purchasing or signing up.
As digital marketers and business owners, we are so used to accessing our website from our main device, usually the desktop, in our daily work of making edits, adding new products or content, and performing web improvement reviews.
We sometimes forget that most of our traffic might be coming from mobile devices and operating systems or browsers different from what we use. It may seem to us that everything is working fine while in reality, a large part of your traffic might be experiencing a conversion killer that is only displaying on mobiles or even certain combinations of devices, operating systems, and browsers.
Thankfully, you can use Google Analytics 4 (GA4) to quickly locate potential issues that are slashing your conversions. All you need is to customize the Tech details report and slice the data to spot the issues that will need your attention.
In this article, I will walk you step by step through your analysis in GA4 and show you how to find potential issues in 20 minutes and what to make out of the data you are seeing.
Disclaimer: this analysis does take minutes, but you must already be tracking your conversion events in GA4. If you aren’t sure what it is, read the first section Review and Upgrade Your GA4 Conversion Setup. If your conversion setup already is solid, then you can skip this section.
As a bonus, I will also share my template of the actionable error log that will save you and your team a lot of time in finding the errors on your website and actually seeing them with their own eyes. (You have no idea how much time is wasted if the developer can’t find and replicate the issue users are reporting. You can’t fix what you can’t see, so the more information you provide the more obstacles you are removing for the dev team.)
Here is what we will go through in this article:
- Review and Upgrade Your GA4 Conversion Setup
- Create Your Web Errors Locator Report
- Identify the Devices and Browsers Your Most Valuable Visitors Use
- Analyze the Web Errors Locator Report to Find Potential Issues
- Log the Issues Using a Time-Saving Template
- Find and See the Issues on Your Website
Let’s start!
Review and Upgrade Your GA4 Conversion Setup
To be able to perform the steps in this guide you need to have the Account Editor access permissions or higher.
In this analysis we are going to rely on the Conversion Rate metric in GA4 so to proceed with it, you must first ensure that your most meaningful website actions are tracked in GA4 as conversions. If your conversion setup is rock solid skip this section.
Your conversion setup in GA4
To review what is being tracked in your GA4 as conversion events go to Admin (the gear icon) then Conversions and see the list.
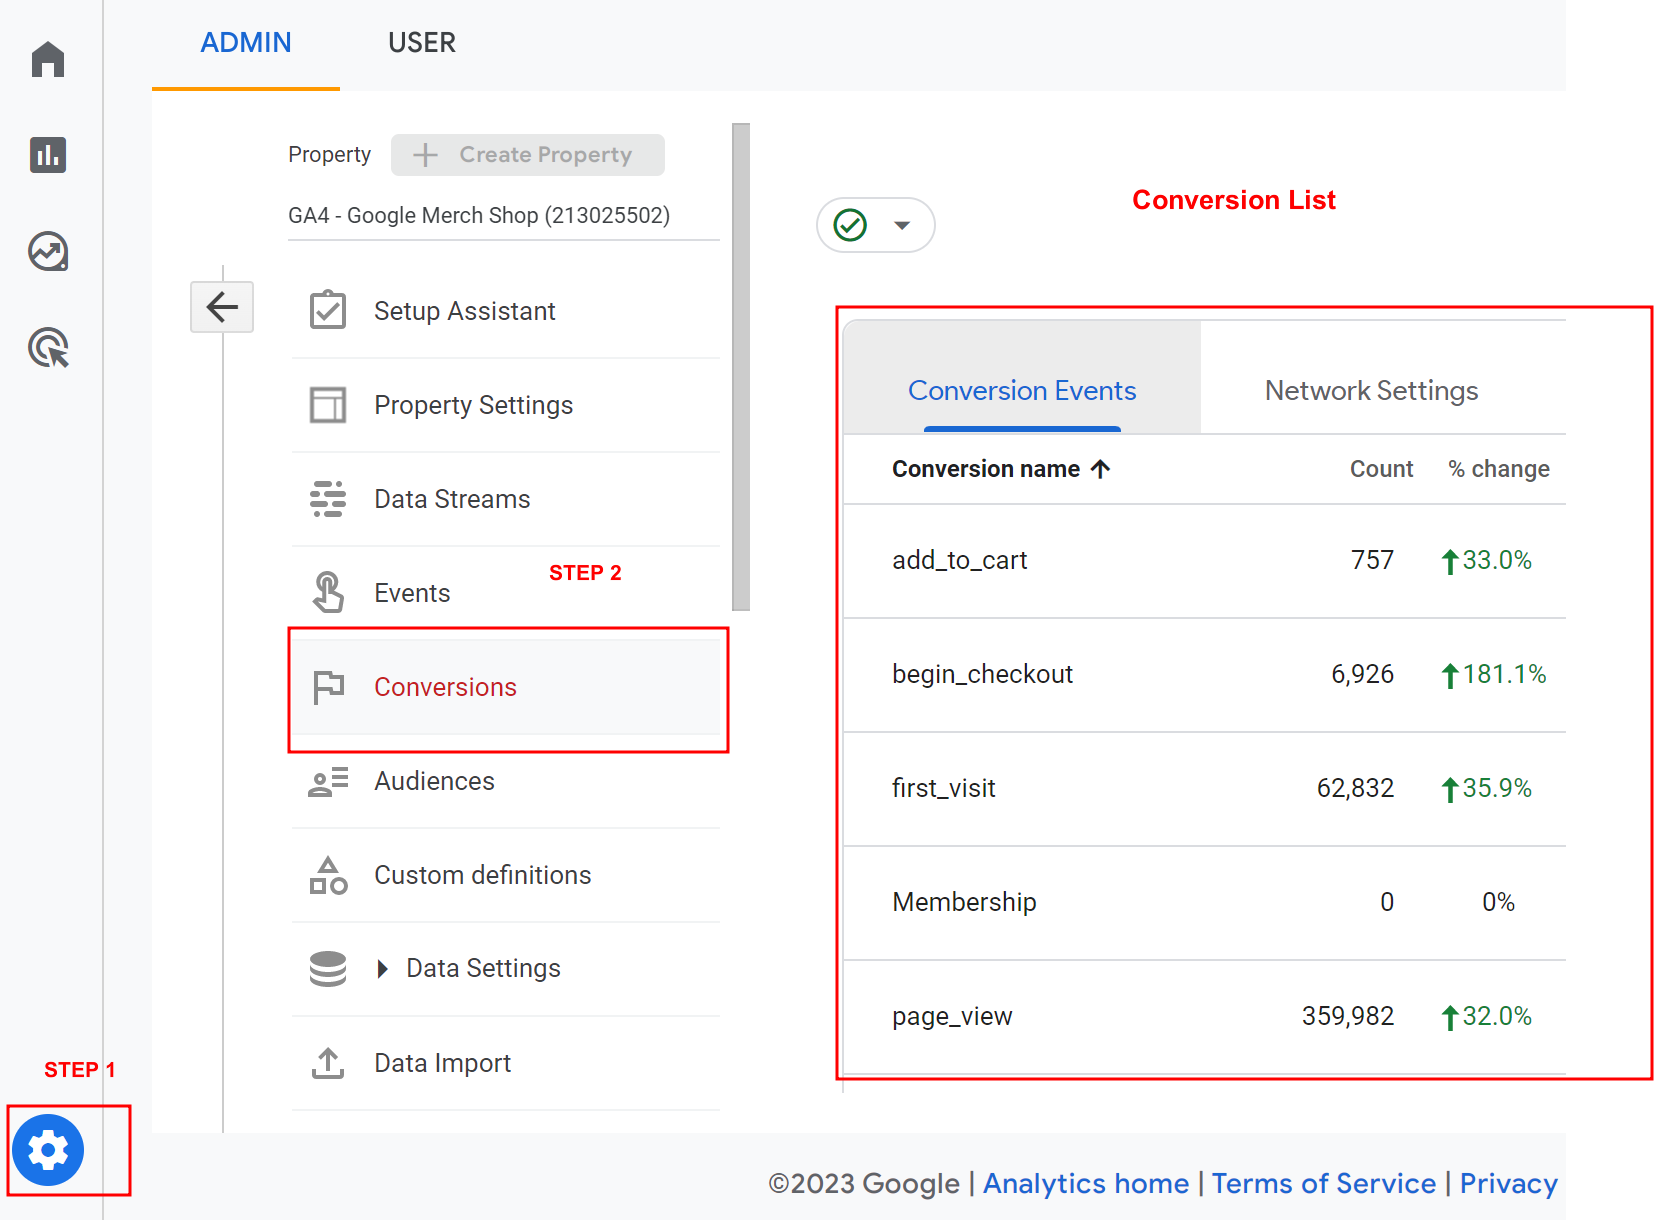
Are conversion events showing on your list? Are all your desired website actions on this list?
By default, GA4 only measures purchase as conversion, so if you never worked on the conversion set up it is likely that this section is empty.
You must create your desired conversion events in your GA4 account using event rules, Google Tag Manager custom tagging, or set up GA4 event push from the tools, plugins, and tech solutions you are using on your website. To be able to run this analysis as a minimum you need to have the final conversion event of your main website objective.
What to track as conversions
The primary objective, the final conversion, and the conversion funnel
Conversions are the most important actions that we want the users to take on our website.
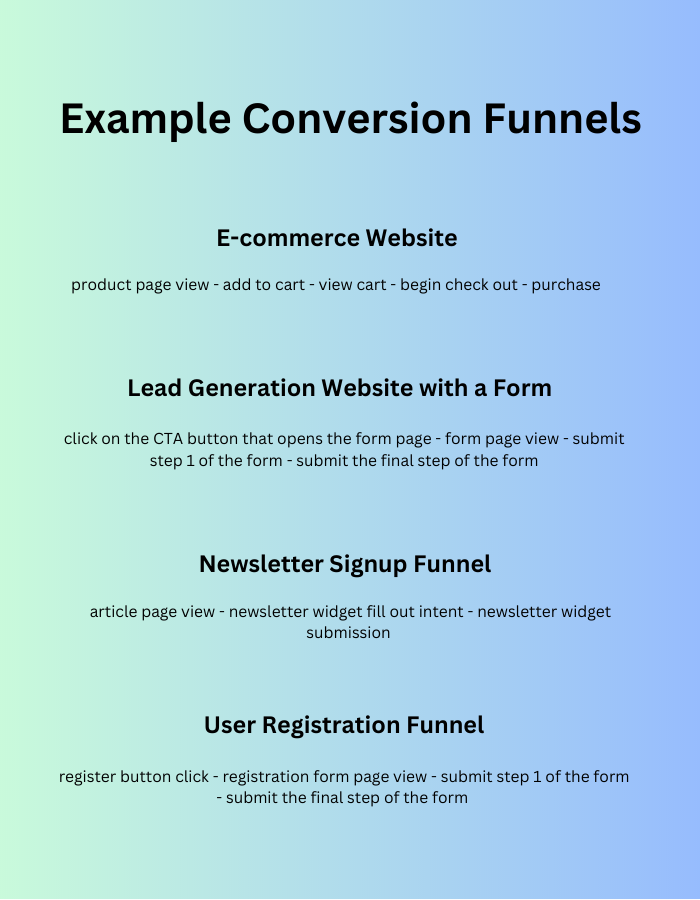
You want to measure the primary objective of your website as conversion events in GA4. Examples are the purchase for an e-commerce website or form submission for a lead generation website. But your tracking should also include the important milestones in your conversion funnel that lead to your final conversion of purchase.
For an e-commerce website, selling is the primary objective, and the purchase is the final conversion. You will also have supporting milestones leading to the purchase such as a product page view, add-to-cart, and checkout initiation. These are important website events that are part of the conversion funnel. As such they should also be tracked in your GA4 setup.
For a lead generation website, the primary objective can be a lead, and the final conversion can be the submission of the quote request form or a demo request. But other supporting actions should also be tracked such as the views of the form, the partial submissions if the form is split into steps, or yet form clicks or fill out intents.
Secondary objectives
Apart from your main objective, each website type can have other meaningful interactions. These might be secondary objectives yet still they reflect an important business goal. Some examples are a newsletter signup or a lead magnet form. Signing up for a newsletter is not equivalent to a purchase but if you grow a handsome list of email subscribers you might promote a new product launch and earn a lot of purchases from your email campaign. As such growing your list is an important objective.
If you have such an important secondary objective, make sure to track them and their respective conversion funnels (the final conversion and if possible the supporting actions).
Exclude internal traffic
Finish your setup review by verifying that you are excluding from your tracking the so-called internal traffic. It is your own activity on the website as well as this of other people who are working on your website such as developers, marketing specialists, writers, etc.
Internal staff doesn’t behave the same way as your customers when using your website, so the traffic generated by staff and collaborators should be excluded from your analysis.
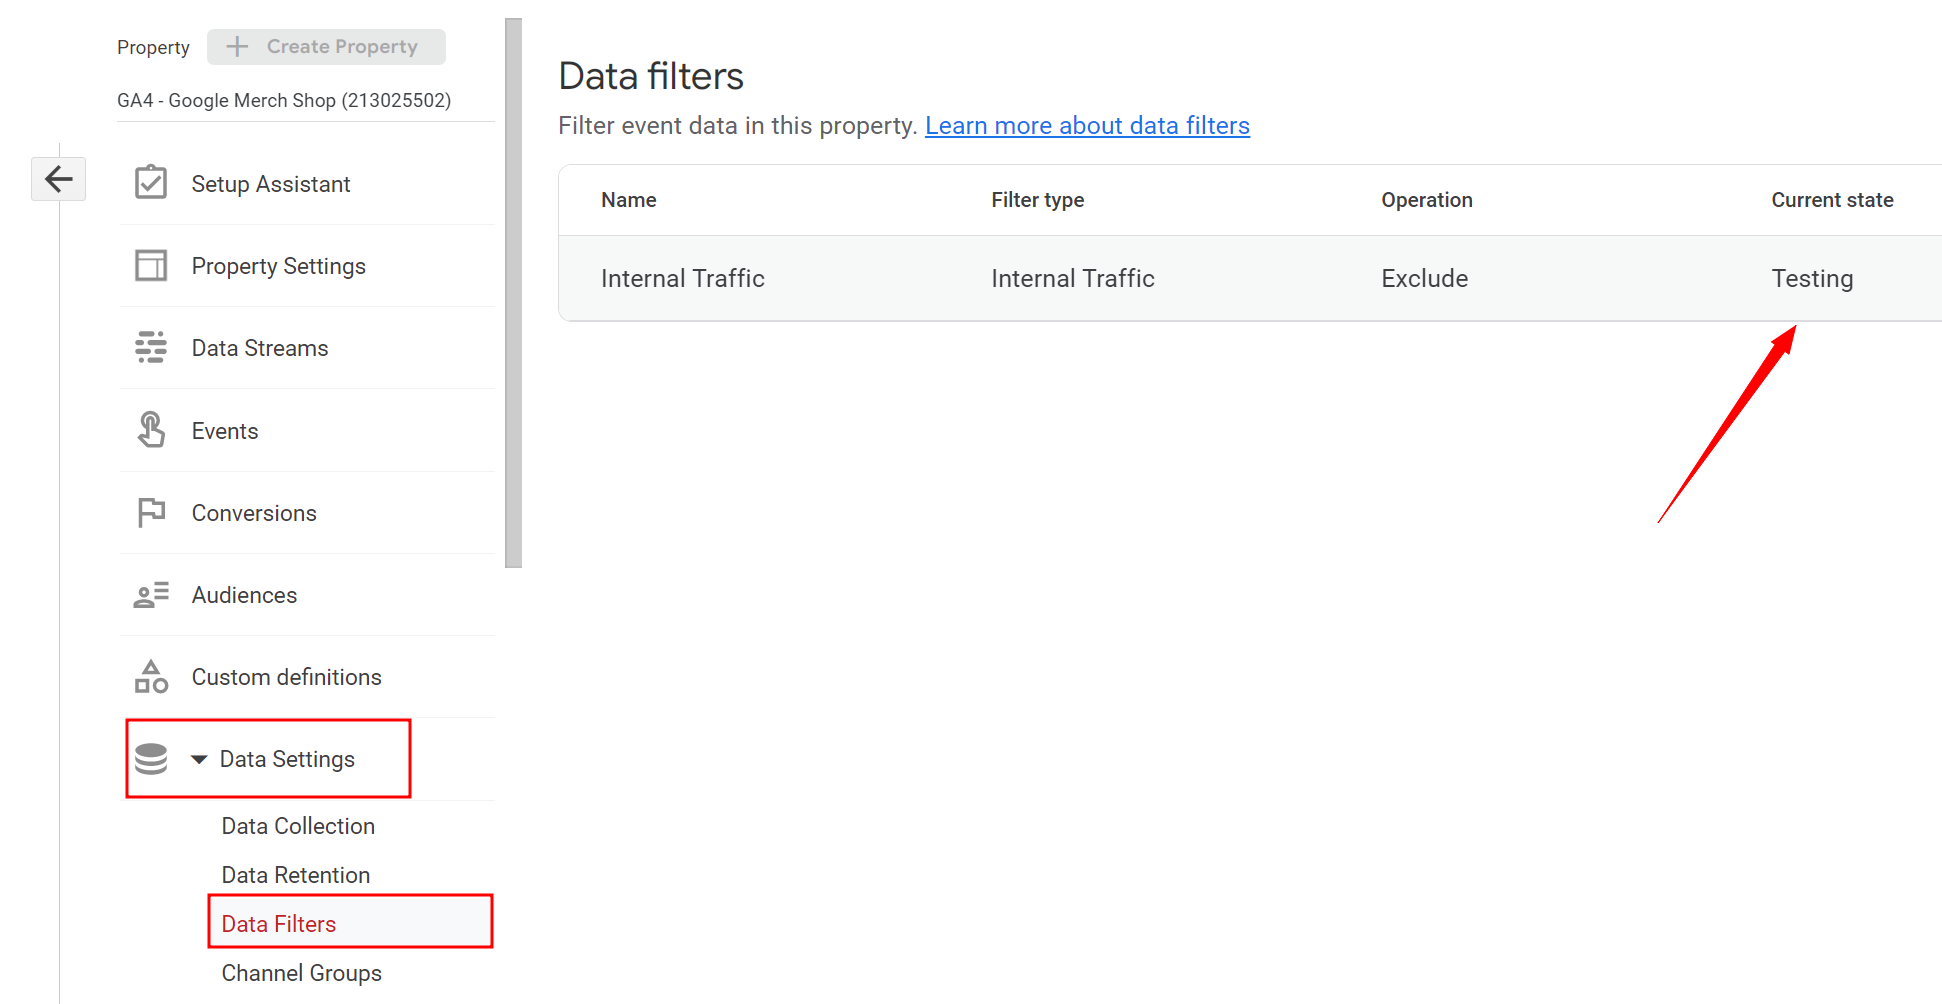
To verify your exclusions go to Data Settings > Data Filters.

By default, you are going to find an Internal Traffic listing with Testing as a Current state. The filter is not excluding anything until it is updated and set to active.
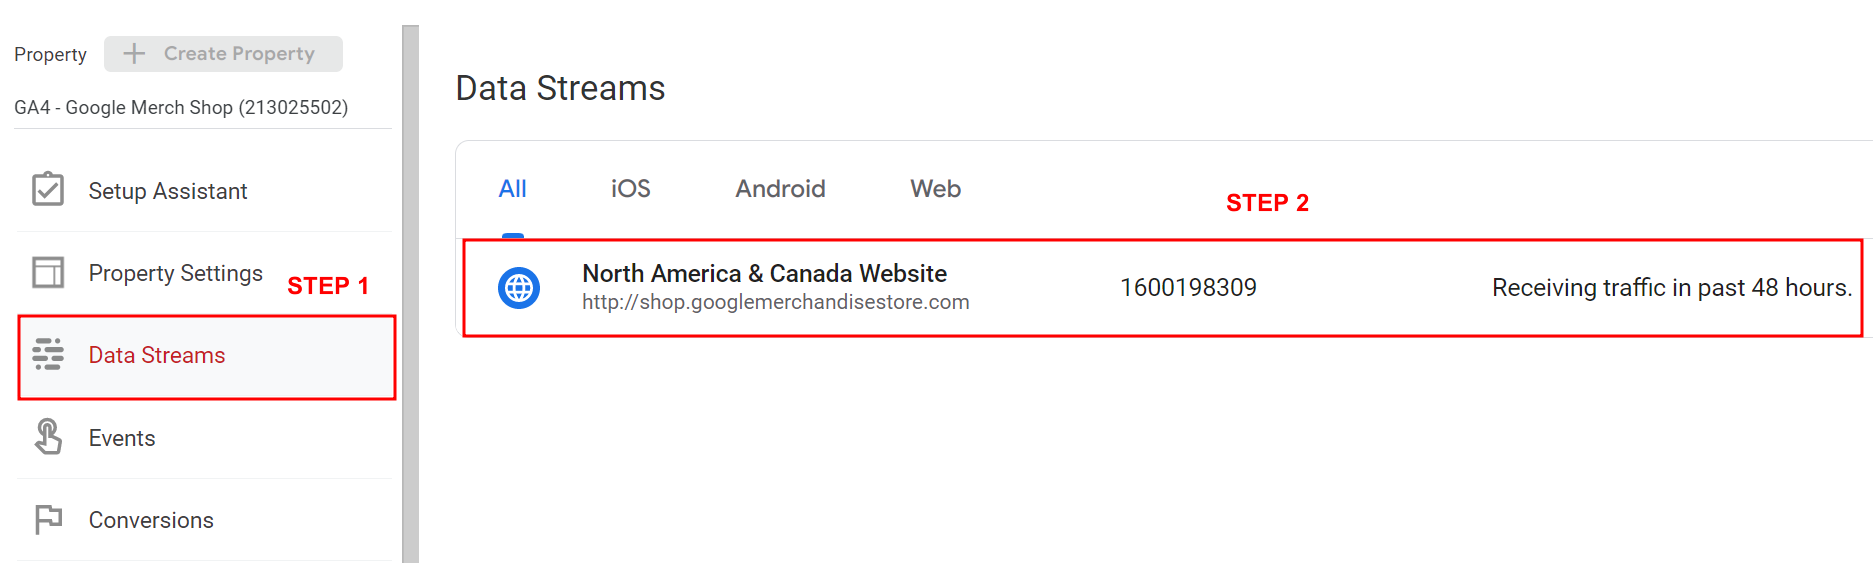
To exclude your internal traffic go to Data Streams then click on your Data Stream.
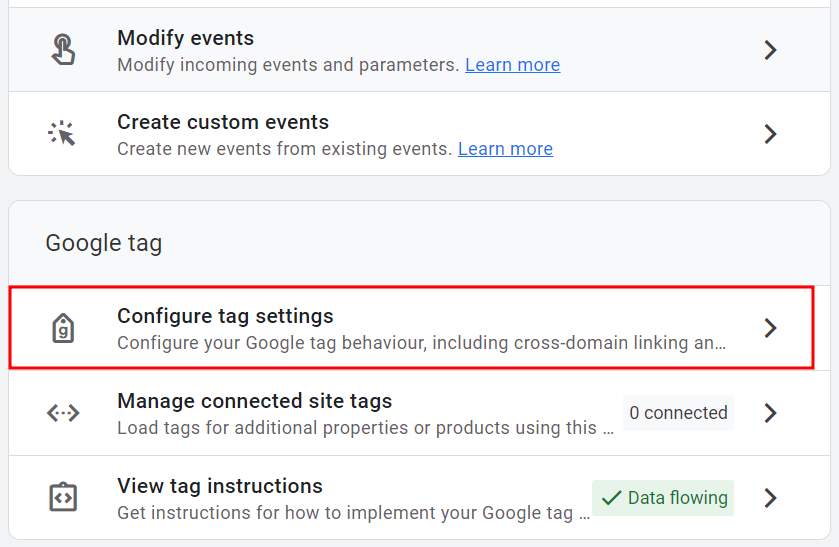
Then under Google Tag click on Configure tag settings
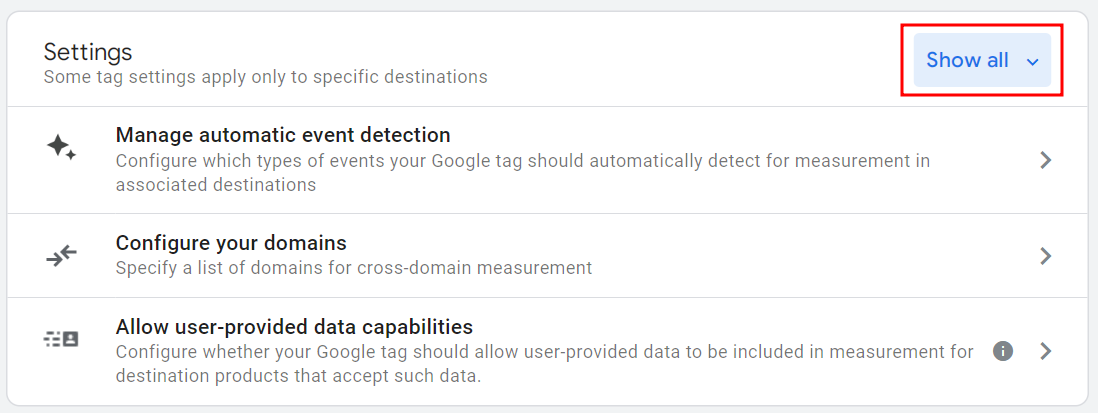
Next, under Settings click Show All > Define Internal Traffic. Then hit Create
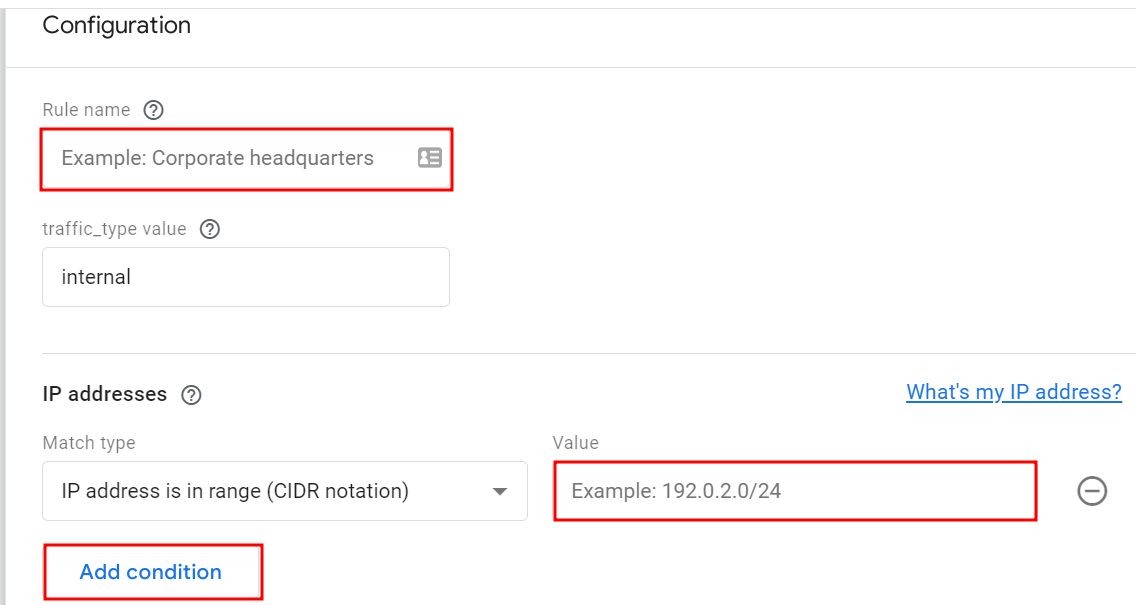
Next, name your exclusion (Office, Home, Dev team’s office, etc) and fill out the IP address you want to exclude. Click Add Condition if you want to exclude multiple IP addresses. Hit Create when you are done.
Now ex out and go back to Data Settings > Data Filters and click on your Internal Traffic listing.
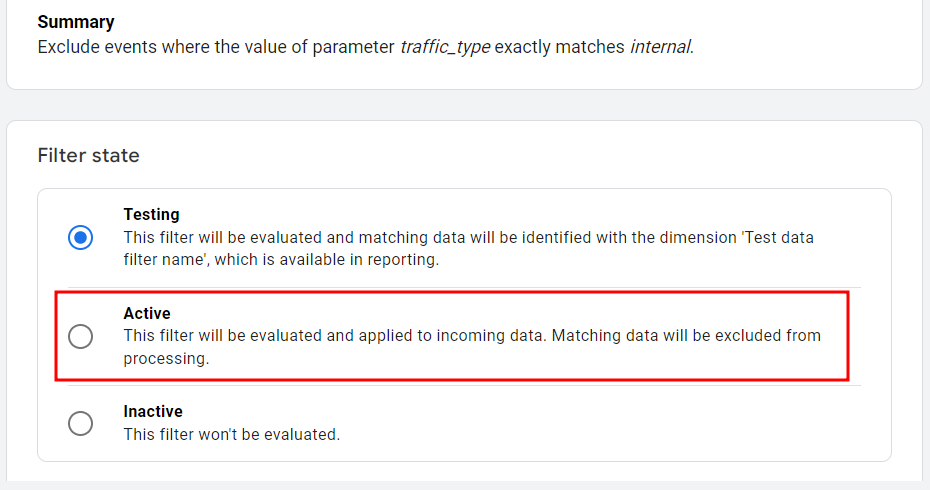
Now, activate the internal traffic filter you have just created. Hit Save.
Well done! You have just updated your GA4 setup.
Create Your Web Errors Locator Report
Now, it’s time to create the report that will help you to identify bugs, errors, and irregularities on the website.
Note: if you just set up tracking for the conversion events that weren’t previously measured, or filters make sure you collect a few weeks’ worth of data before you start this analysis.
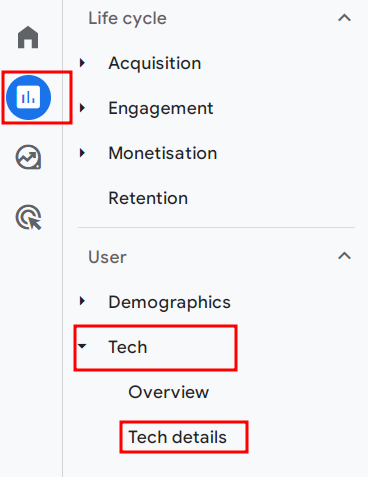
Go to Reports and then under User choose Tech > Tech details.
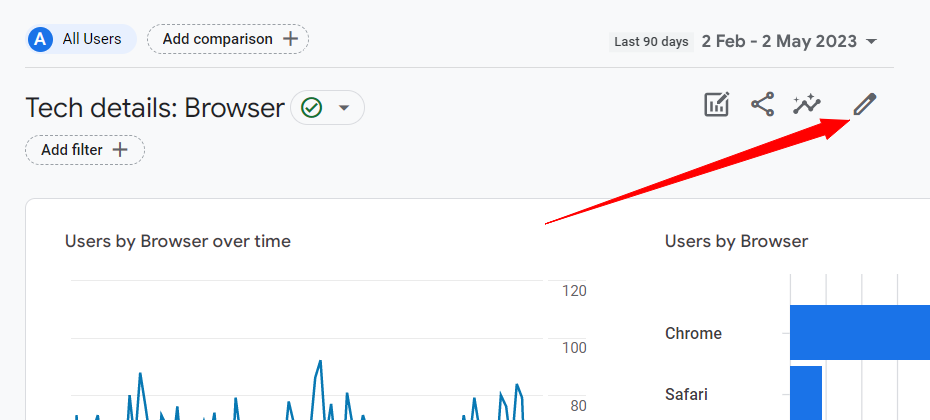
Click the pencil icon to customize the report.
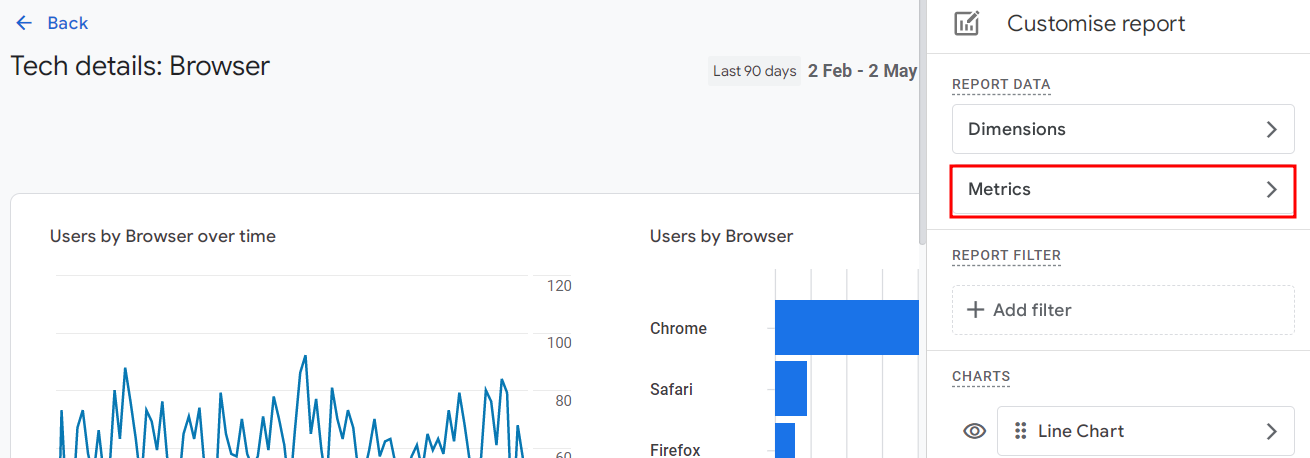
Now you are going to define the metrics of your report. Click Metrics.
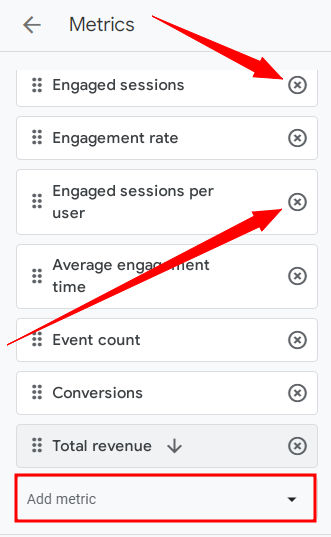
Metrics to remove: New users, Engaged sessions, and Engaged sessions per user.
Metrics to add: Sessions, User conversion rate, and/or Session conversion rate. Hit Apply.
User conversion rate is the percentage of users who performed your desired action that you measure as the conversion event.
User conversion rate is better suited if your website objective is to convert a user once. Good examples are quote request form submission or newsletter signup. In those cases, your goal is to sign a new client or add a person to your newsletter list and you don’t generate extra revenue if they send you three quote request forms for the same service or signup twice to your newsletter.
User conversion rate is also useful when your objective is to convert more of the users that are coming to your website even if they may need multiple sessions to convert. As such an e-commerce purchase might be best measured with the user conversion rate.
Session conversion rate is the percentage of sessions in which your desired action (conversion event) was completed once or more times.
The session conversion rate was the default conversion rate metric in Universal Analytics. This metric was criticized, specifically because it’s not very useful when analyzing website objectives that aim at converting a user once or converting users more efficiently.
However, there are cases where it is useful and these are all the situations when you are expecting the users to complete an action every time they are in a specific place on your website. If you have a user login page, you expect your users to successfully log in every time they are on that login page. If you are seeing low session conversion rates for the login attempt it may mean you have bugs or usability issues on your website. A user conversion rate may be less insightful in those cases.
Save and name the report, e.g. Web Errors Locator.
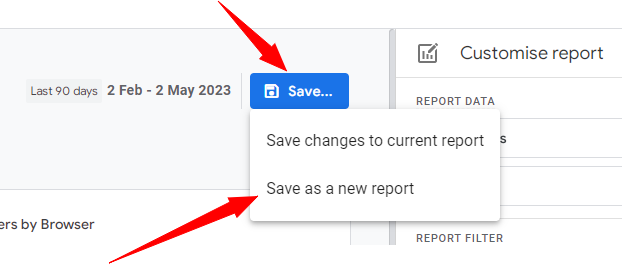
Identify the Devices and Browsers Your Most Valuable Visitors Use
Let’s start analyzing!
In the first step, let’s figure out how your most valuable users view your website. Are they on an iPhone, a Mac, or a Windows computer when they buy from you or register? This is a crucial piece of info that will help you make better decisions about your website. The next time you are making changes to your website make sure to make decisions that can positively impact the visitors accessing from those devices.
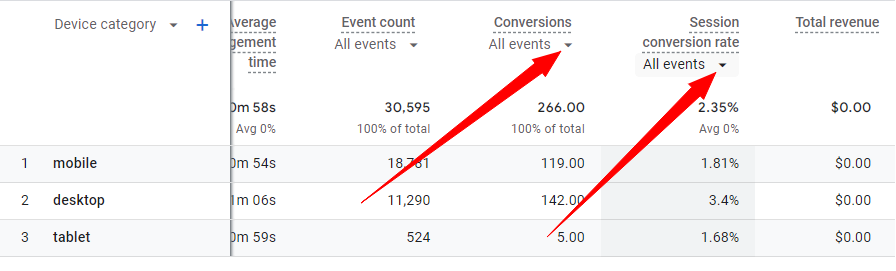
To identify what gear your most valuable users are on when they visit your website choose the Device category as your dimension.

Now, filter your conversions and conversion rate metrics by your most important conversion, be it a purchase, a form submission, or others.
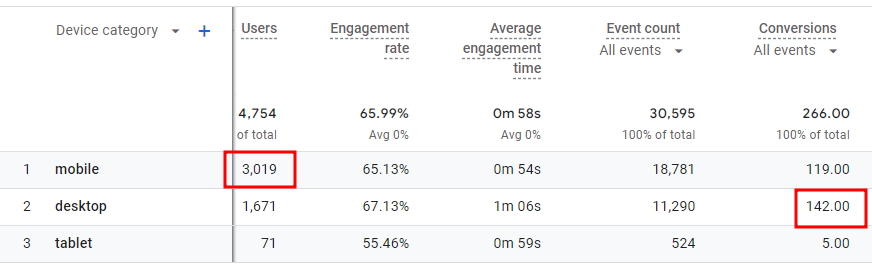
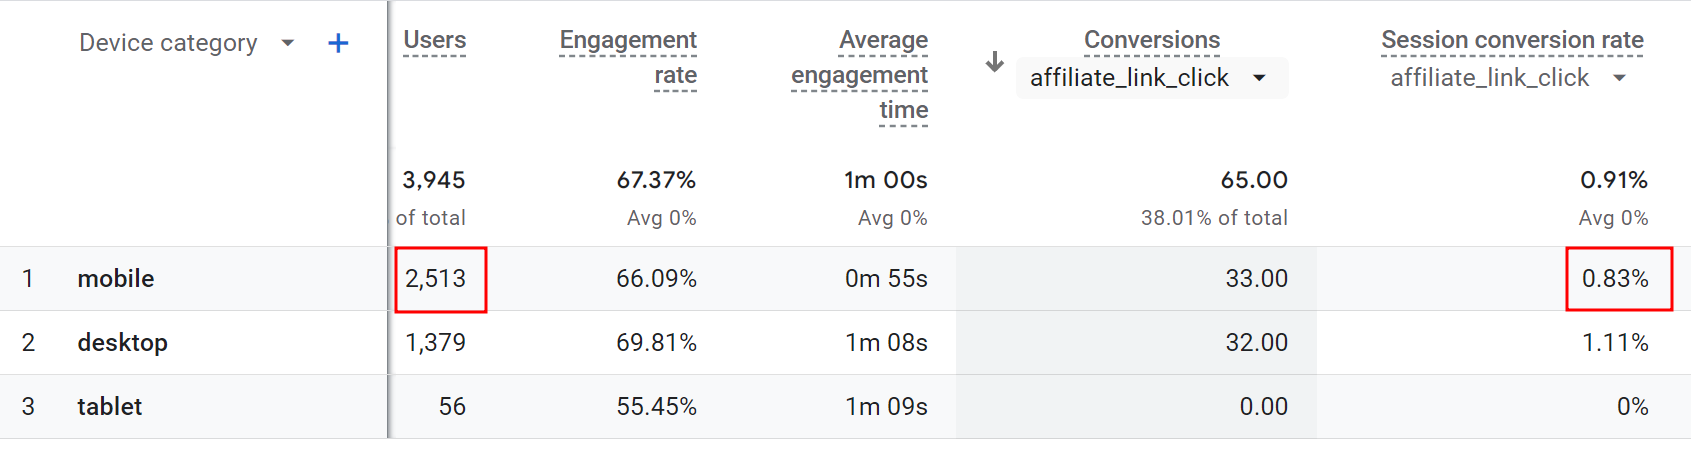
Are most of your users and conversions coming from desktops or mobile devices? In the website that I am reviewing, most users visit the site on mobile devices while most conversions take place on desktops.
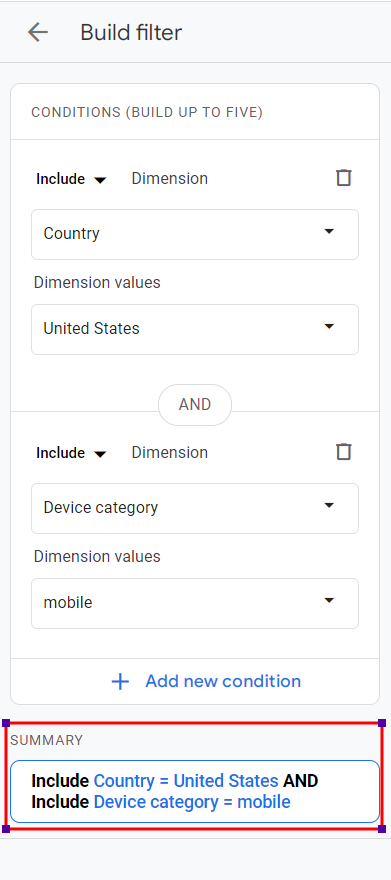
But your website visitors are not all equal to your business. Let’s think about who your most valuable users are. If you are selling or providing services exclusively in one country, state, or city it makes sense to narrow down your view of data, because you don’t need to analyze the users who will never become your clients.
If you didn’t know that yet, most successful websites written in English generate high volumes of users from various English-speaking countries, such as the US, India, Canada, the Philippines, etc. If you are targeting users in a specific geo area you should reflect that in your analysis.
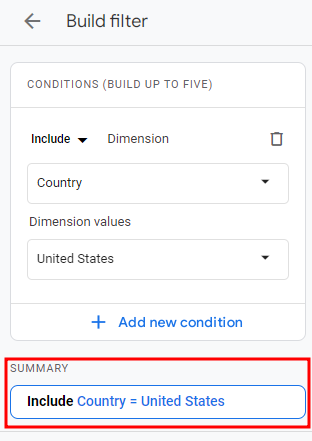
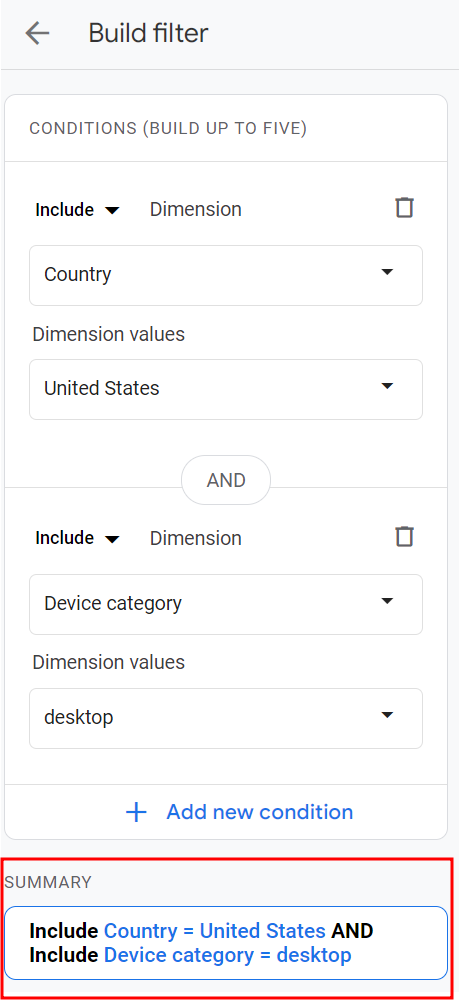
To create a geo filter select Add filter in the right-hand menu.
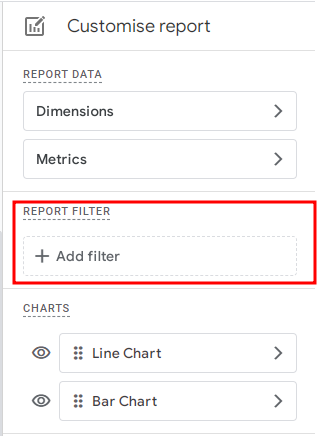
Next, click Include and select your territory type from the drop-down, either Town/City, Country, or Region (select this to choose a state).
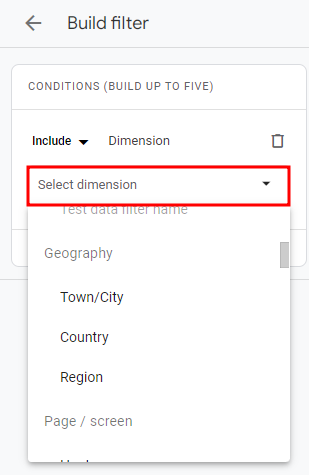
Pick the right value from the list, review the summary, and hit Apply.
Have you seen a change after applying the filter? Are your visits coming from mobiles or desktops? Which device are your conversions coming from?
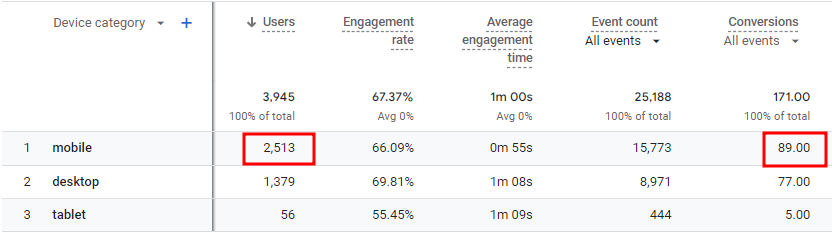
For the website I am analyzing, after I applied the geo filter the results have changed. Previously, I saw that most users visited from mobiles while most conversions took place on desktops. Now I can see that while most users are still visiting from mobiles, most conversions happen on mobiles. Aligning my report to better reflect my real audience has lead me to different data and will possibly result in different conclusions.
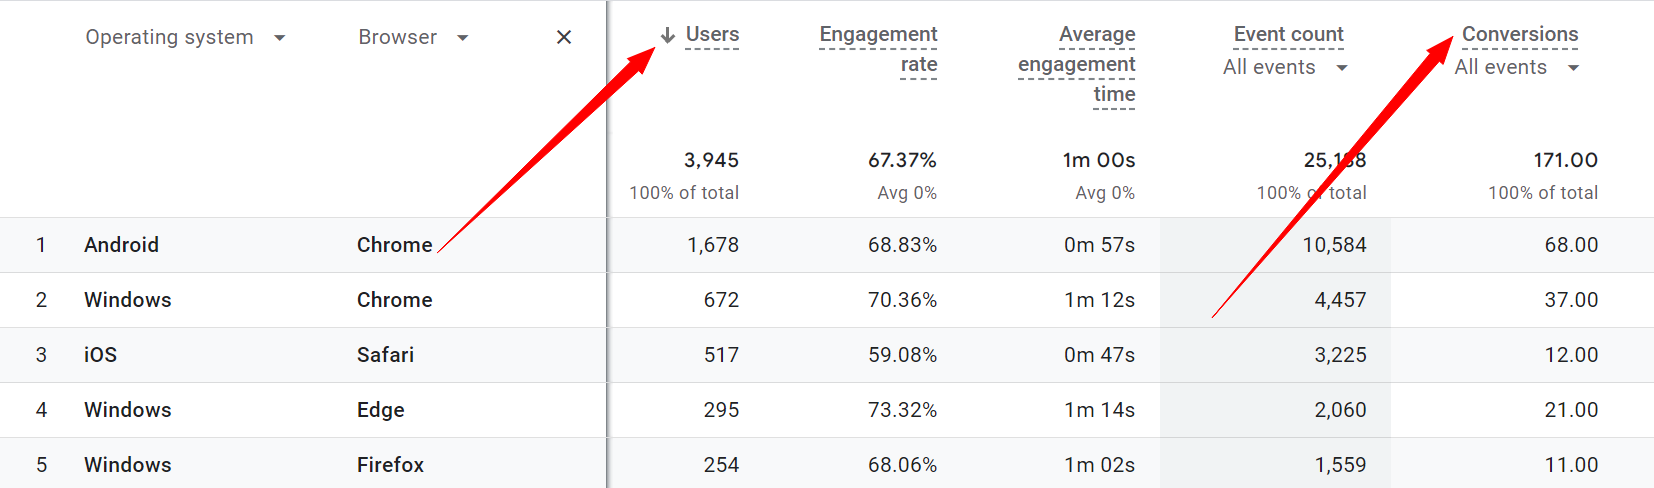
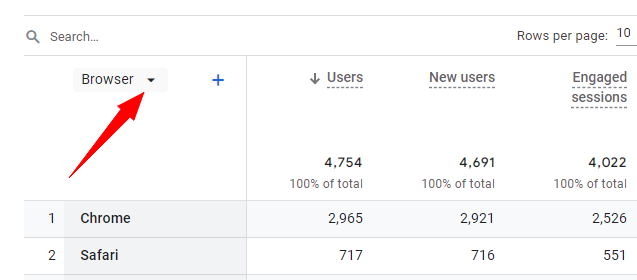
To go deeper and identify the tech profile of your most valuable user segment pick Operating system as your dimension and Browser as your secondary dimension.
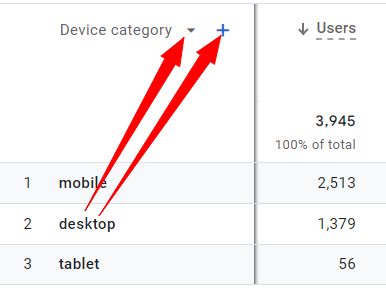
Now use the sorting arrow to identify the combination that brings in the highest volume of users and the one that converts the highest volume of users.
First sort by Users, highest to lowest number. Write down this combination of operating system and browser. Next, hover over Conversions and the arrow will appear, click on it to sort by Conversions, highest to lowest.
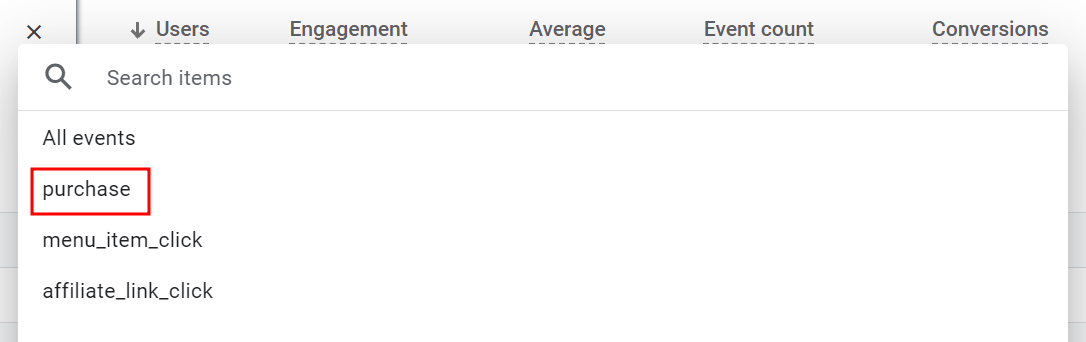
If you are tracking many events as conversions in GA4, you can go a step further and use the conversion filter to identify top-performing combinations for your most important objective.
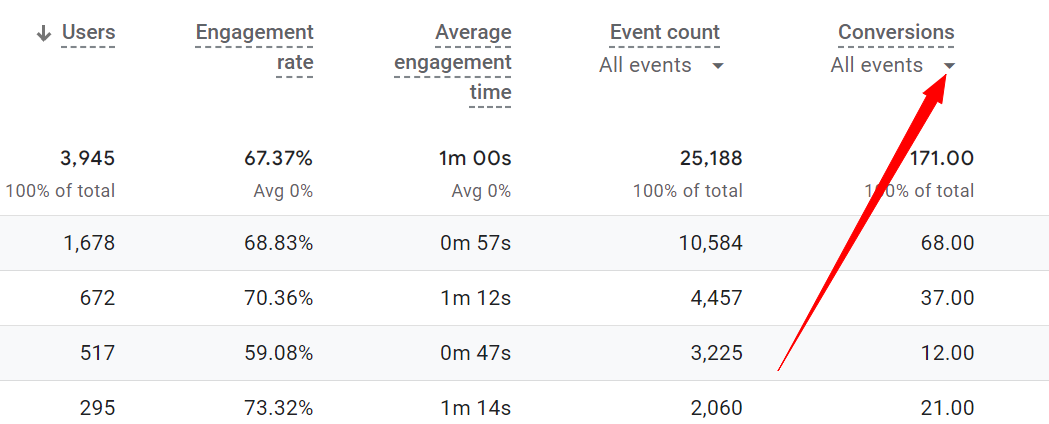
Choose just your most important conversion to identify the device combination for your most valuable conversion action, be it purchase, or form submission. In my analysis it is the affiliate link click but for an e-commerce website it is the purchase.
Write what tech gear combinations play the biggest role in your website visits and conversions.
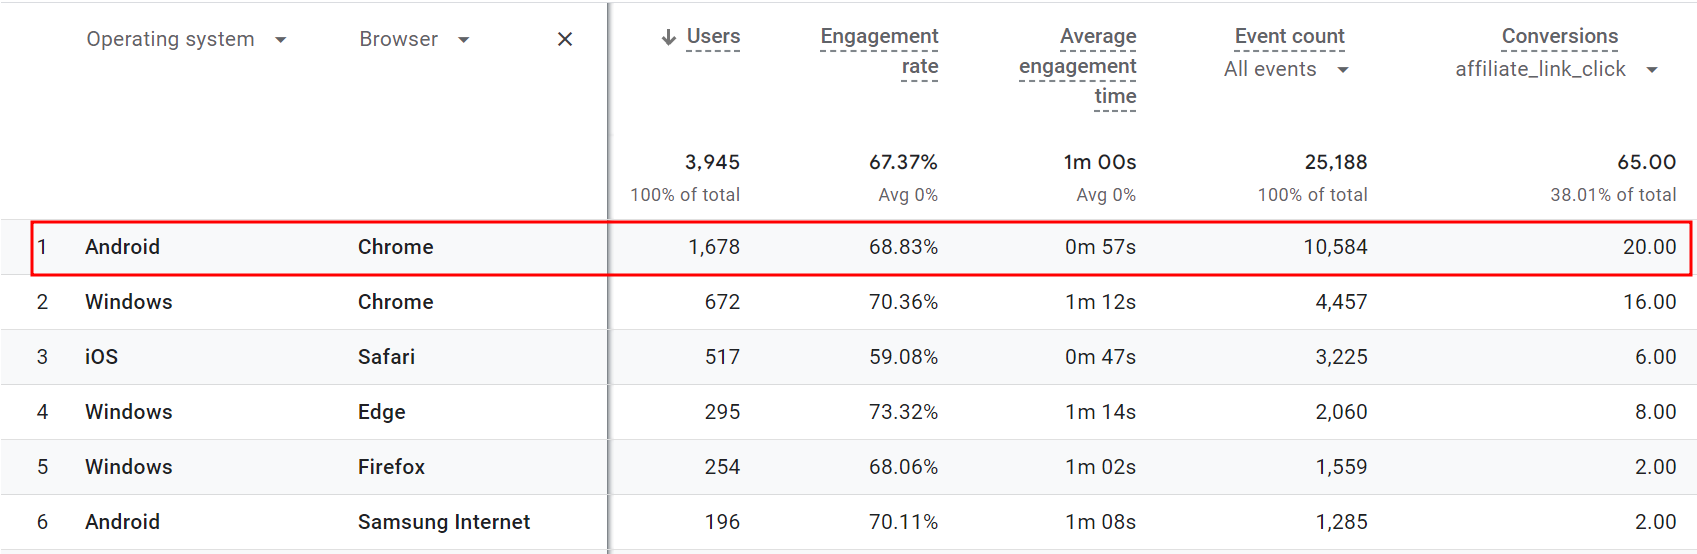
In my example, Mobile, Android, and Chrome is the top combination of how the users access the site and convert. There is a close second of Desktop, Windows, and Chrome, this combination has lower levels of traffic but a close number of conversions.
Make sure to record and consider this information when you are making web decisions such as adding features, improving, and changing user flows e.g. if you are building a new lead magnet. Make sure those decisions make sense on the devices your most valuable segments use. Make sure the changes are implemented in an optimal way for those devices. Always perform tests on those devices before you implement important changes.
In my example, if I am adding a lead magnet popup I need to make sure it looks and works amazing on mobile devices, specifically on Androids. I will test it on a few Chrome browser versions. I will make sure my popup is sized correctly to fit the mobile screen, the image is not cut off, and all the copy fits well. I will also double check the popup is easy to close and that the closing doesn’t refresh the page and scroll the user up taking them away from where they were when the lead magnet popped up.
Diagram:
most users see my website on
most converters/customers see my website on
Find Potential Issues Using the Web Errors Locator Report
Now let’s start looking for potential bugs.
Your analysis is going to be based on the comparisons of the conversion rates across report dimensions and dimension drill-downs. The method consists of locating the outliers and suspicious differences in the conversion rates.
Start by setting a filter for the final conversion event relevant to your main website objective. Set it up for your Conversions and Conversion rate metrics.
As an e-commerce website start with a purchase. Lead generation websites choose your conversion event such as a quote request submission.
Select Device category as the dimension.

Let’s look at the conversion rates.
A typical scenario will display low conversion rates for mobile devices despite the highest volume of users or sessions. Is that what you are seeing?
It doesn’t necessarily mean that your website presents bugs on mobile devices. Research shows that conversion rates for online shopping websites are lower on mobile devices than on desktops. It is a pattern and some of the explanations behind it are a preference for a large screen when taking important actions such as purchases.
Knowing that this pattern exists, it makes sense to continue our analysis separately for desktops and mobiles.
To set up a Device category filter go to Report filter. If you previously applied a geo filter for country, region or town you need to remove it and start over.
Under Select dimension recreate your geo filter. Then use AND to create another condition. Choose Device category as a dimension and pick desktop. Hit Apply.
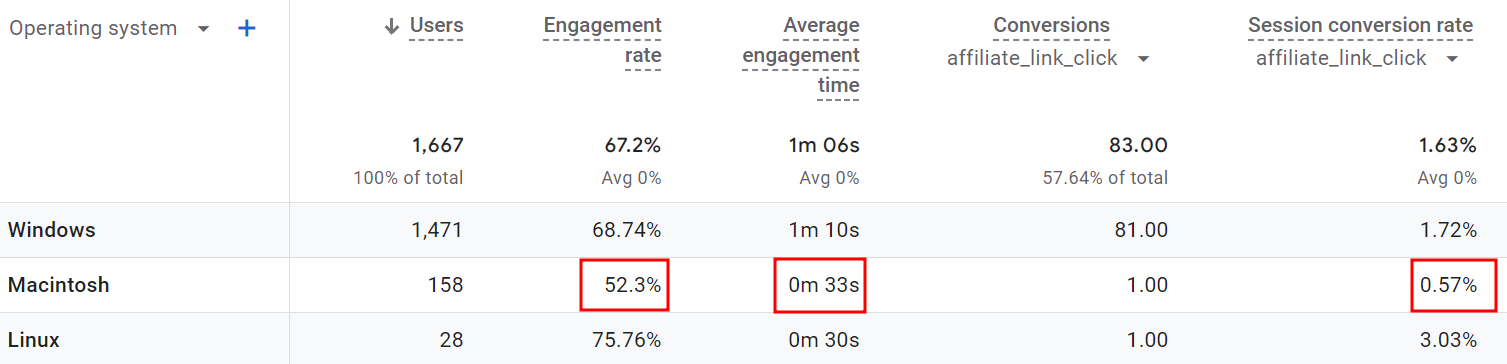
Next, select Operating system as your dimension.
Now look at your conversion rates. Are you seeing an operating system that has a conversion rate of 0% or much lower than others despite a high volume of users or sessions?
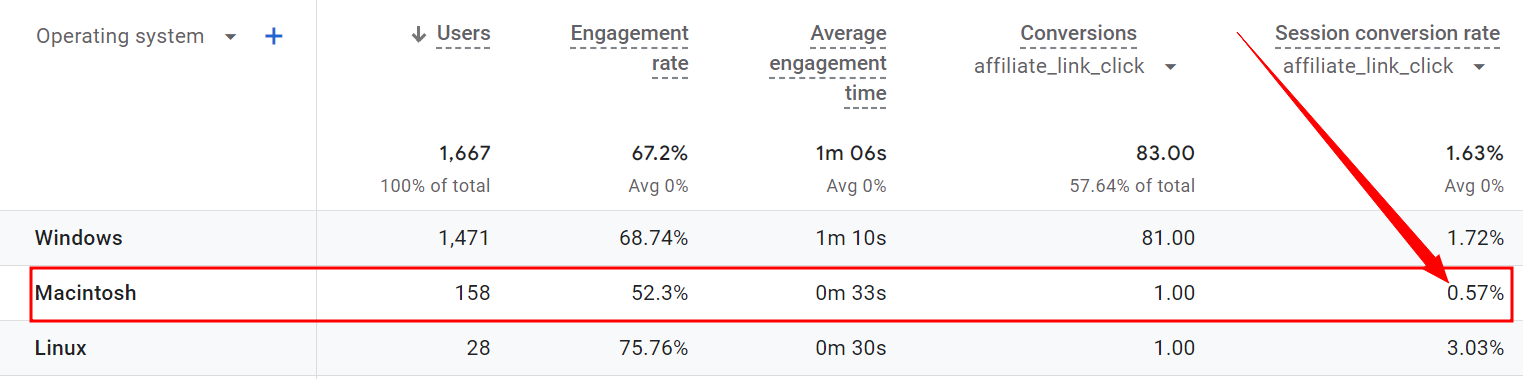
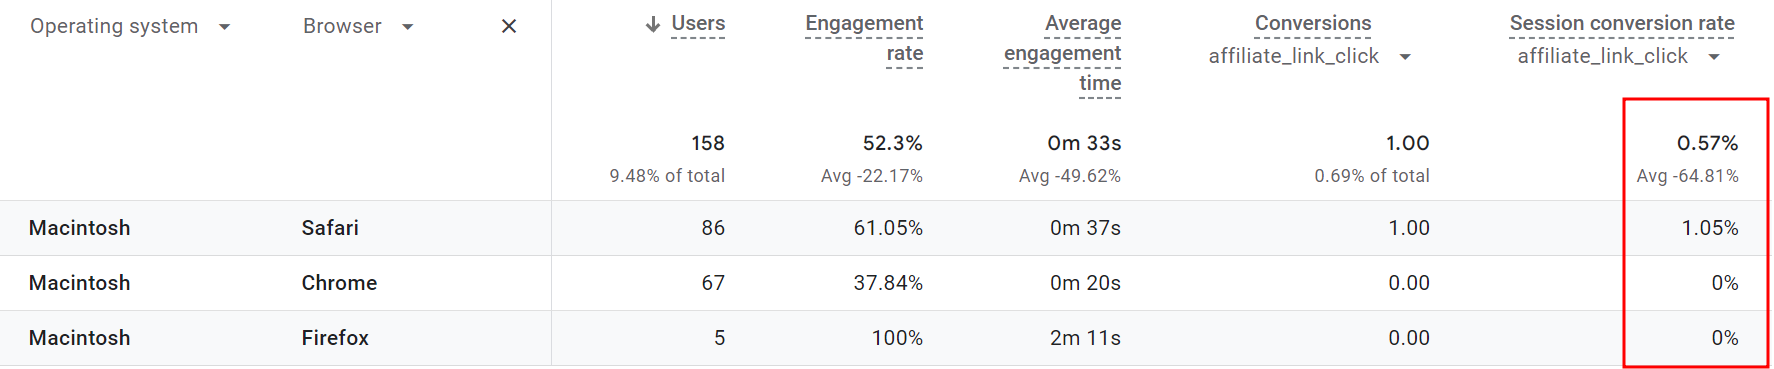
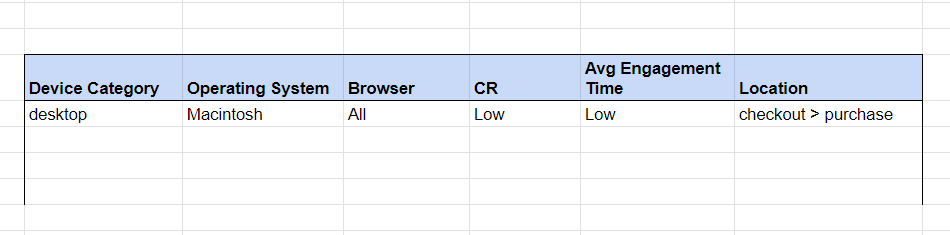
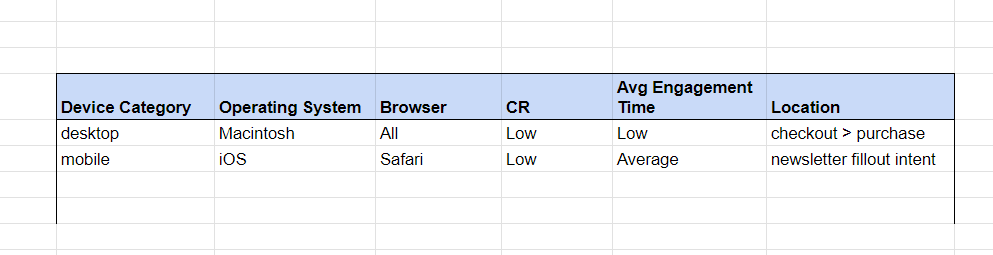
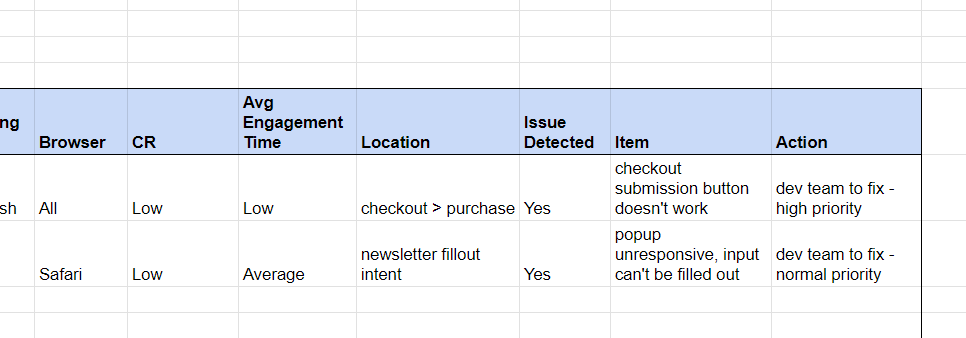
In my example, I have a low conversion rate for Macintosh. But at the same time, I can see that the volume of Macintosh users for the analyzed period is just 158, so I am aware that I don’t have a large pool of data here. The low conversion rate may indicate an issue or it may just be that my sample of sessions is too low to show significant patterns. For the sake of this analysis, I am going to treat it as a possible error and investigate further.
If you are seeing in your data a clear outlier among operating systems, continue slicing the data.
To proceed, let’s check if the anomaly can be related to a specific browser.
To drill down, add a secondary dimension of Browser. To align all Macintosh entries one under another I used the Search function. Type the operating system you want to look at.
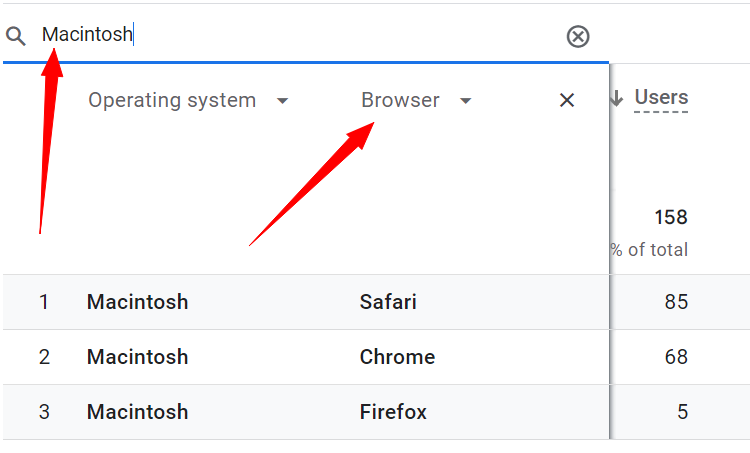
Are you seeing a browser with a very low or zero conversion rate despite a high volume of users or sessions?
In my example, only one browser has registered conversions. But you might find in your analysis that there is an issue with just one browser having a very low conversion rate.
Again, in my example the sample is small so I need to take my results with a grain of salt. But if you are seeing a good volume of users and sessions but zero or low conversion rates for one operating system or one browser you can take this analysis further.
Analyze other metrics. To figure out what type of bug you might have look at the engagement metrics, i.e. average engagement time.
If you see a very low conversion rate and also an average engagement time noticeably lower than others it may mean that one of the pages doesn’t load correctly on that operating system and browser resulting in users abandoning the website.
If however you are seeing a low conversion rate but no visible difference in average engagement time it may mean that there is an issue with the conversion funnel or the final conversion event. The users are taking the time to try and complete the action but cannot finalize it. Examples could be the form cannot be filled out or won’t submit or a CTA button is not displayed correctly or doesn’t work, etc.
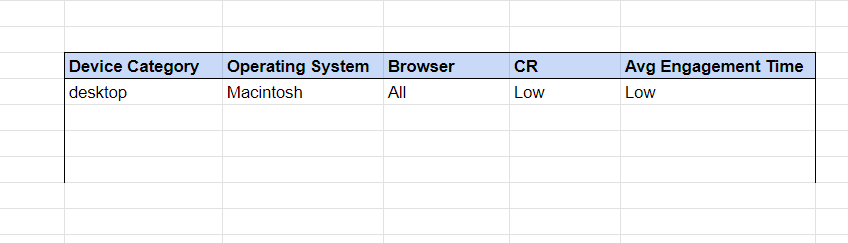
Create an Error Log
If you think you located a suspicious item, it’s time to create your error log which will help you in the later stages of this analysis. You can use my template for this.
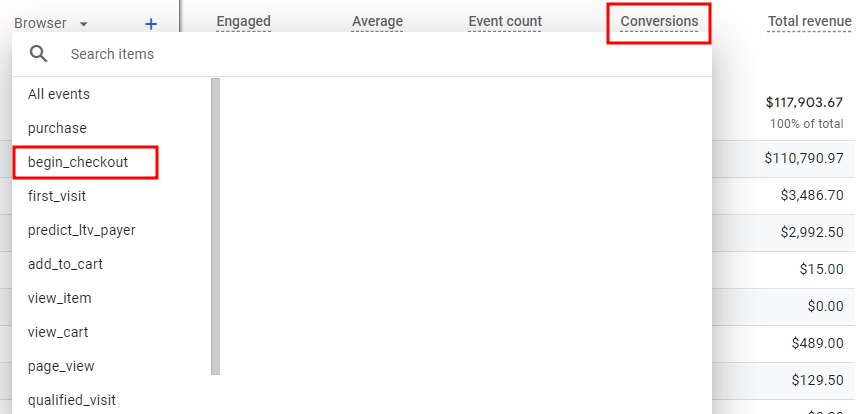
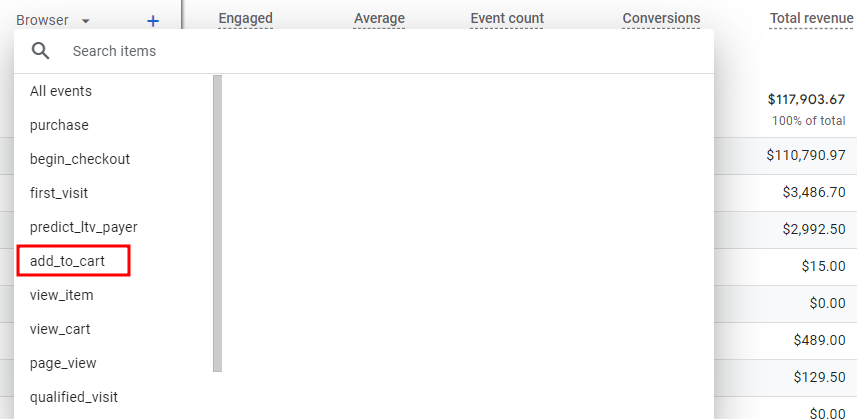
Next, you are going to investigate which stage of your funnel might be affected by an error.
You will be able to narrow it down if you are tracking multiple conversion events in your funnel. For an e-commerce website, it could be begin checkout and for a lead generation website, it could be the form fill out intent or the form view.
If you have such a conversion event on your conversion list in GA4 then use it to apply a filter to your conversions and conversion rate metrics.
Repeat the steps.
Choose the operating system as your dimension. Are you seeing a similar trend, meaning is the conversion rate low for the same operating system that you noticed before with your final conversion? Add the secondary dimension of browser and compare conversion rates. Are you seeing the same trend?
If you are not seeing this trend here, meaning there is no big difference in conversion rates on this level it is likely that your website has an issue with the final conversion action such as checkout or form submission. Add this info to your error log as it will be useful in further steps.
If however, you are seeing this trend for your second last conversion event then your website might be presenting issues in earlier stages of the conversion flow. To investigate further repeat the same steps for a previous conversion event if you are tracking it in GA4.
Can you locate between which two conversion events the conversion rates started diverging? Write this down on your error log.
You have now concluded the analysis for one device type (desktop) and collected actionable information about possible errors on your website as it is accessed on desktops.
Analyze Behavior on Mobile Devices
Now let’s repeat the same steps for mobile devices. Change the report filter to Device category > mobile. Remember to also apply the geo filter if your target audience is local.
Now choose the operating system and filter the metrics by your final conversion. Look for outliers. Drill down to examine browsers. Examine previous steps in the conversion flow to find out if the anomalies can be pinned down to a specific place between two conversion events.
Write down the outliers you spotted.
Well done, you have now collected the intel on possible bugs in your main conversion channel.
If you have a secondary objective such as a newsletter signup or a lead magnet submission repeat the same steps and remember to slice your reports by device category first and analyze mobiles and desktops separately as these device categories tend to present important differences in conversion rates.
Review Your Website
After you finish analyzing this report and come up with a list of potential suspects you will now run a website review, looking for issues in the specific places of the conversion flow and on the specific combination of device, operating system, and browser.
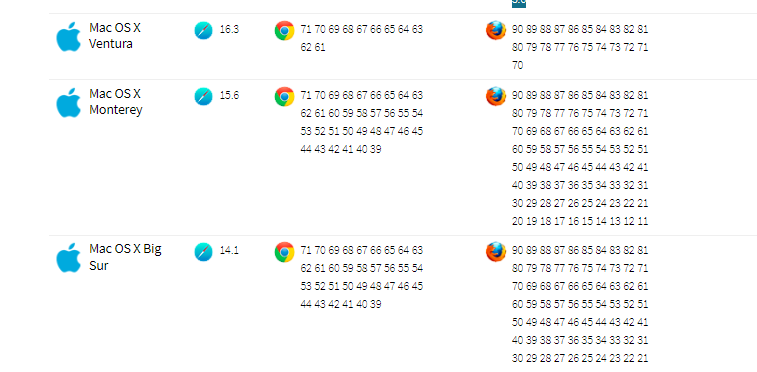
You can use a tool like Browser Stack to review your website for the right combination of devices, operating systems, and browsers. Remember to repeat your revision for multiple browser versions. It may be that only one browser version is causing issues. Here is a screenshot from their website showing examples of browser versions and operating systems the tool offers for your testing tasks.
When doing this review your task is to follow the conversion funnel. Try to complete a purchase, or fill out your form. Are you seeing something unusual?
Things you are looking for:
- Does the page load correctly – does it take a long time to load, are all the elements rendered correctly, is the formatting looking correct
- Are all elements working properly? The page scrolls correctly, the buttons and links are clickable, and the forms can be filled out and submitted correctly
- Are any distracting interstitials popping up interrupting the conversion flow? Are they taking up the entire screen size? Do you have 2 or more interstitials popping out one after another? Can the interstitial be exed out easily?
- Is the next step in your conversion flow clearly visible? Especially on mobile devices make sure that the CTA button is visible.
Complete your analysis by adding info to your log and deciding on the next steps.
Found bugs and errors? Send the error log to the developers, and have the issues fixed. If you can include the screenshot of the issue that you located or record your screen when you are going through the conversion funnel and stumble on the error. This will greatly help your developers.
Found other improvement opportunities? Create hypotheses and implement A/B tests.
Takeaways:
In this article, you have learned how to find conversion-killing errors in one hour.
More specifically, you now know:
- how to slice the data in GA4 to quickly spot problem areas on your website,
- how to create an actionable error log with our findings that will serve you to make fixes
- how to perform a website review to address those findings to locate the specific bugs and issues to be fixed
It’s important to track your most important website actions and exclude internal traffic. Use conversion events to track the final conversion such as a purchase, a form submission, and others. Don’t stop there, track actions leading to that conversion. It’s the quickest way to figure out at which stage your conversion process is flawed.
Go a step further if you have secondary website objectives. Are you growing an email list for future promos and product release email campaigns? Make sure to measure and optimize the email signup process.
Remember that you are likely to see that conversion rates are lower on mobiles than on desktops. Ensure you are running the analysis separately for desktops and mobiles.
Leave a Reply